This week's rotation:
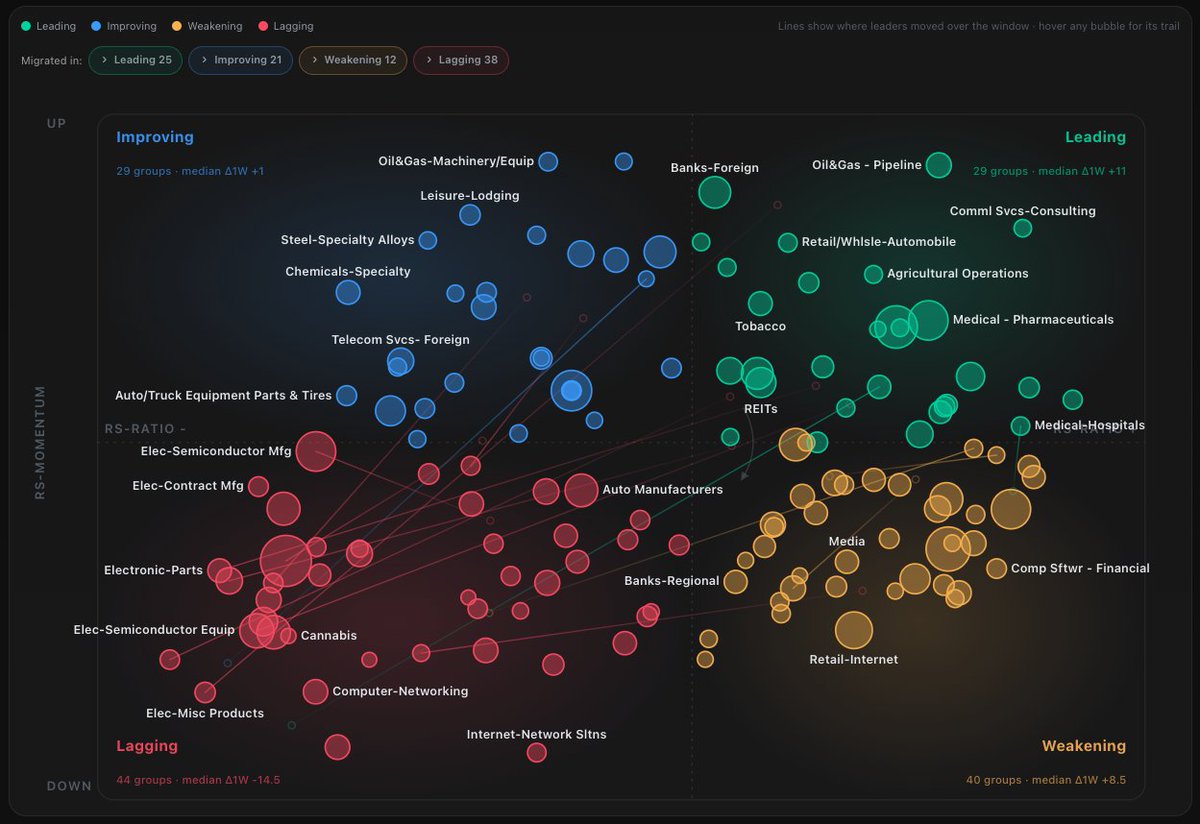
OUT → chips, electronics, hardware.
The runaway YTD leaders (+75–280%), now overbought.
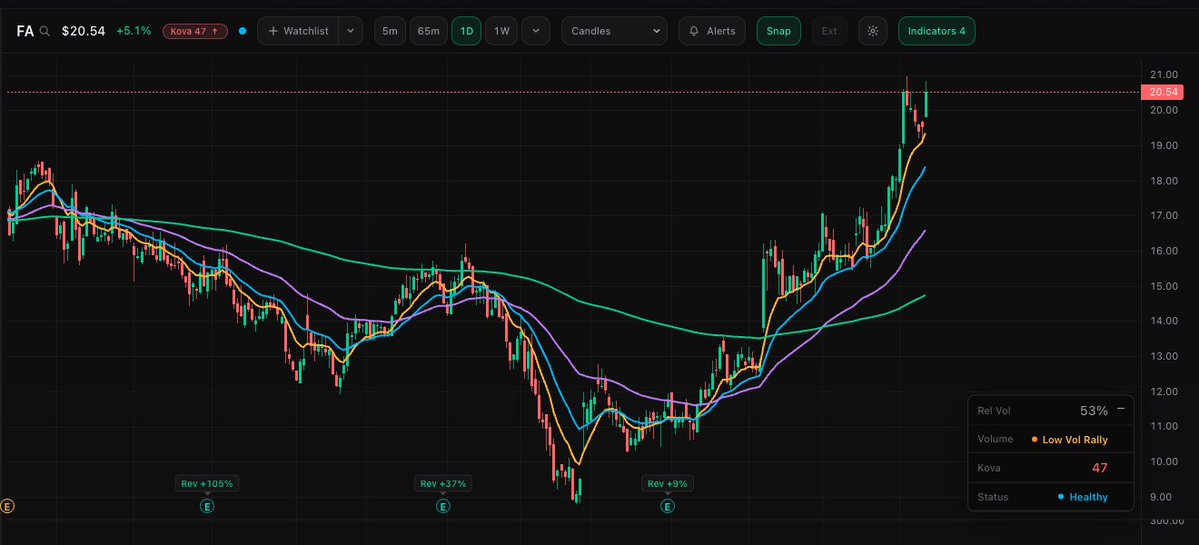
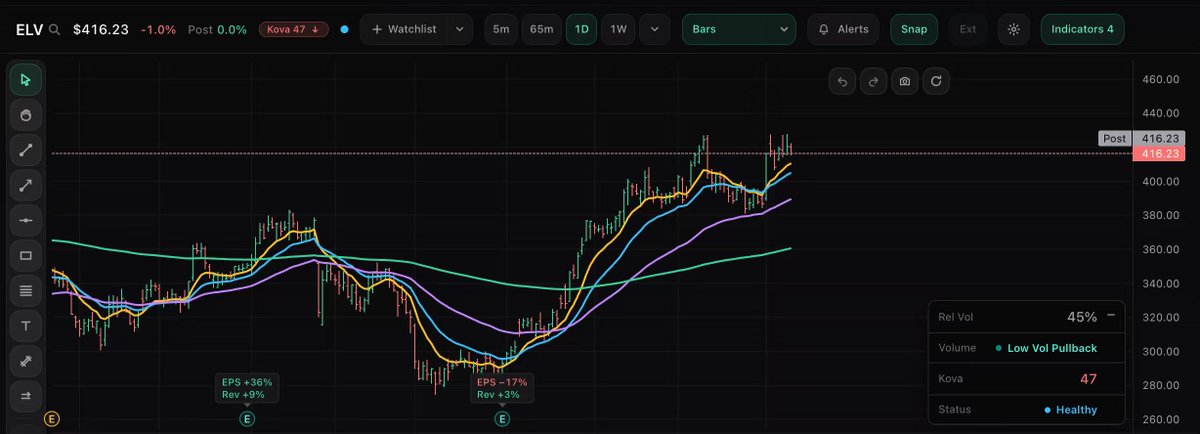
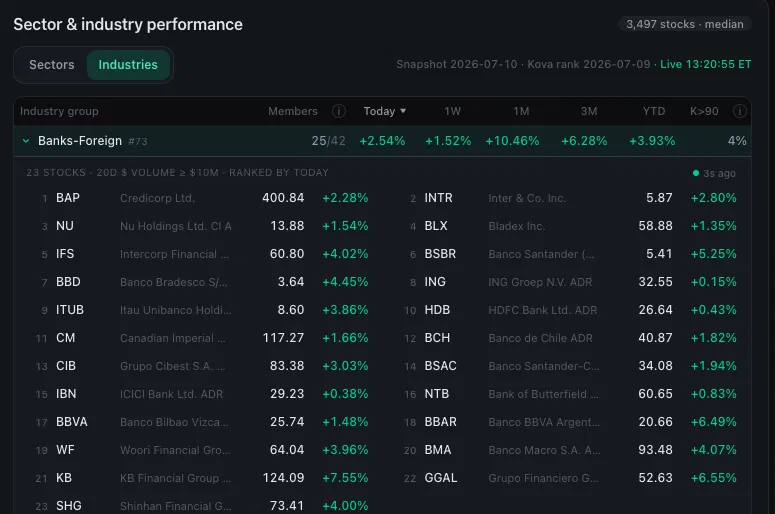
IN → medical, financials, defensives. Leading the tape, printing fresh highs.
Rotation, not a top.
I built a 3D map of the entire AI supply chain.
Who buys from whom.
Bubble size = net income.
Real GAAP numbers.
Click any company to see its customers, suppliers, and margins vs industry average.
Free to play with 👇
Feedback welcome!
$GOOG $MU $SNDK $NVDA