Krystallize is defining success in the Cloud. Public, Private, Hybrid, Traditional - QoS measures are needed for confident and successful business decisions.
Earlier this week, Microsoft Azure beat AWS, earning the 10 year Joint Enterprise Defense Infrastructure (JEDI) contract worth $10 Billion. Naturally, we ran the numbers and are ready to discuss in our latest blog.
https://t.co/hPMMVZMpFQ
#Azure#AWS#Jedi#CloudPerformance
While Amazon Web Services and Google Cloud have been squaring off, Microsoft Azure has made it's way into the ring. What does the data tell us? How does this affect your cloud performance based decisions? Read our latest blog to learn more.
https://t.co/l3CsVwPcpY
BREAKING NEWS: Bigger isn't always better! Autoscaling and provisioning additional machines leads to waste in some cases. In our most recent blog we discuss how less is more, if used properly.
https://t.co/tOT5LqklKG
#googlecloud#amazonwebservices#softlayer#Azure#Cloud
Read about how our #CloudQoS was used to test and show show that Direct Link provides application access with more than 55 times the throughput and less than one-fiftieth the latency of the Internet.
https://t.co/Fojy6l71hH
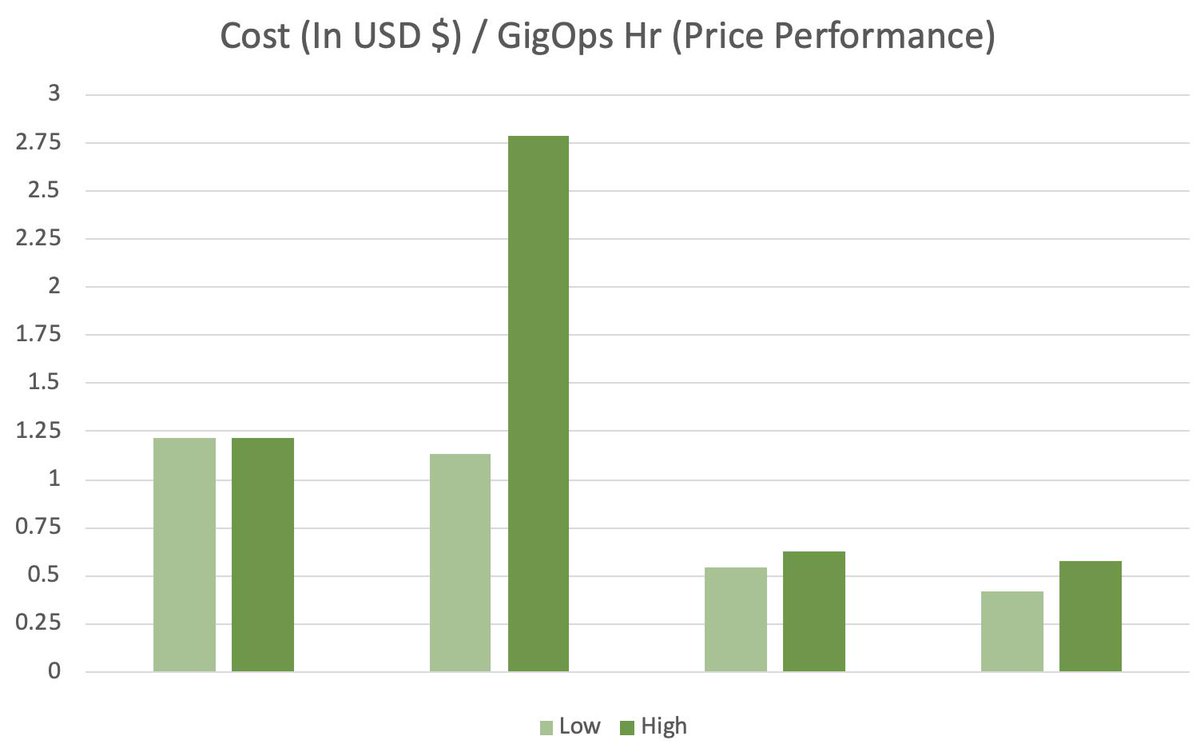
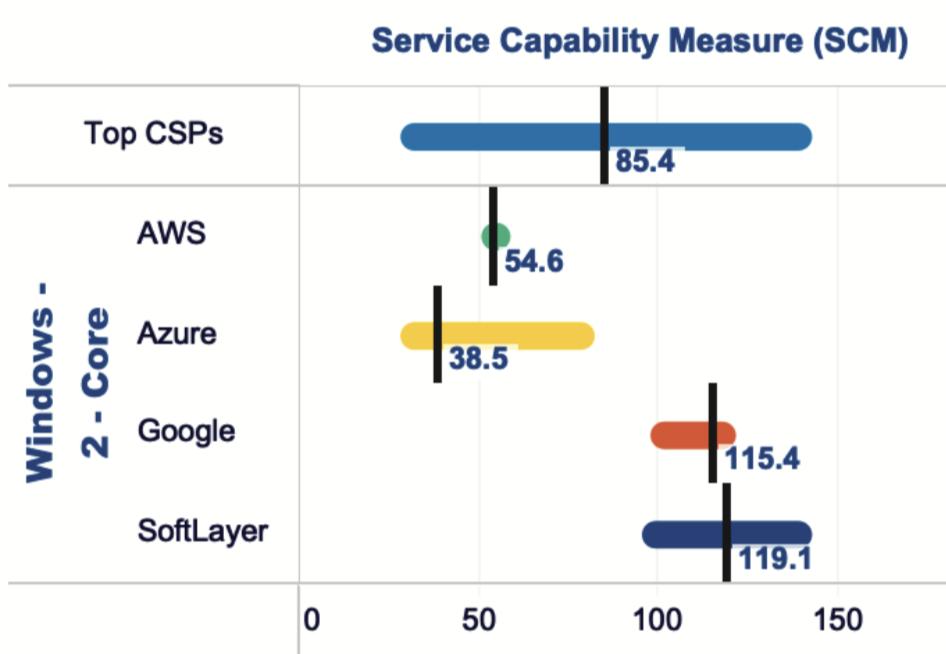
After a split decision during the @SAP Battle, @awscloud continues punching with almost ZERO variability in price performance. While the rest of the competition hosted much larger price swing, AWS only had a single penny of variance for Windows 2 Core in the month of June 2019.
We took a closer look at the recent round of SAP Battle between @Amazon Web Services (AWS) and @Google Cloud, now taking price into consideration. After careful deliberation, the results... Split Decision!
#sap#amazonwebservices#googlecloud
https://t.co/0MQ2yrodvg
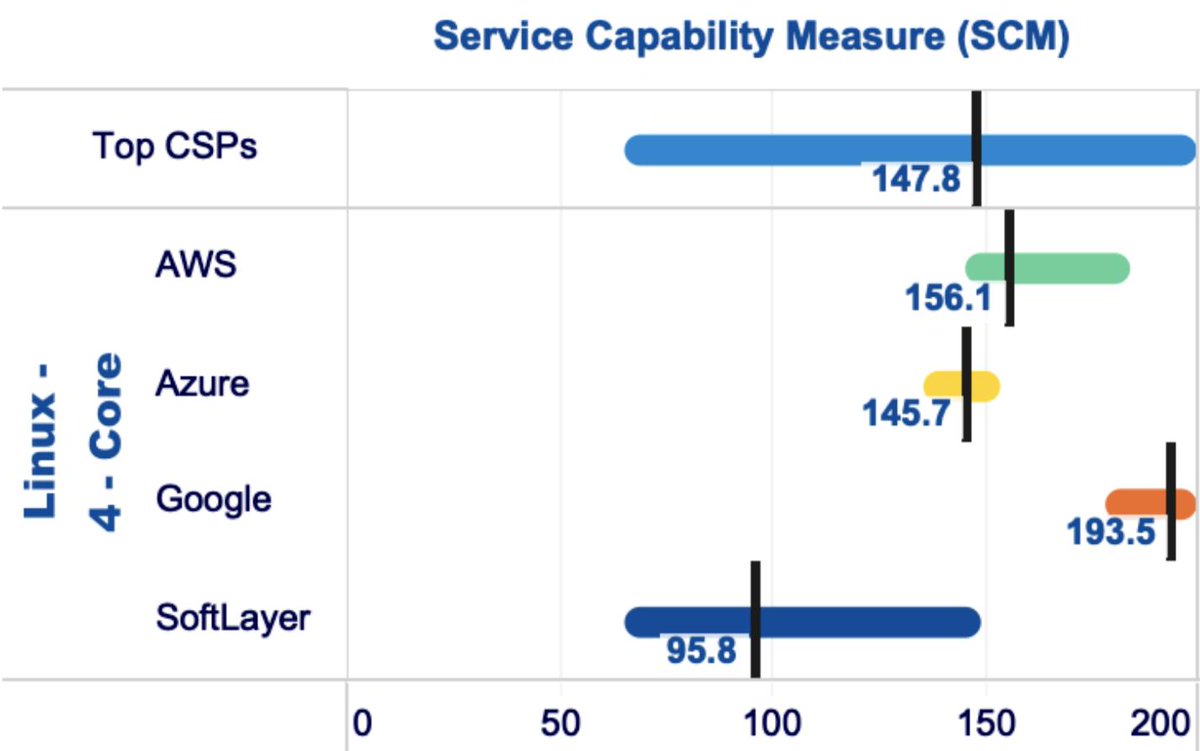
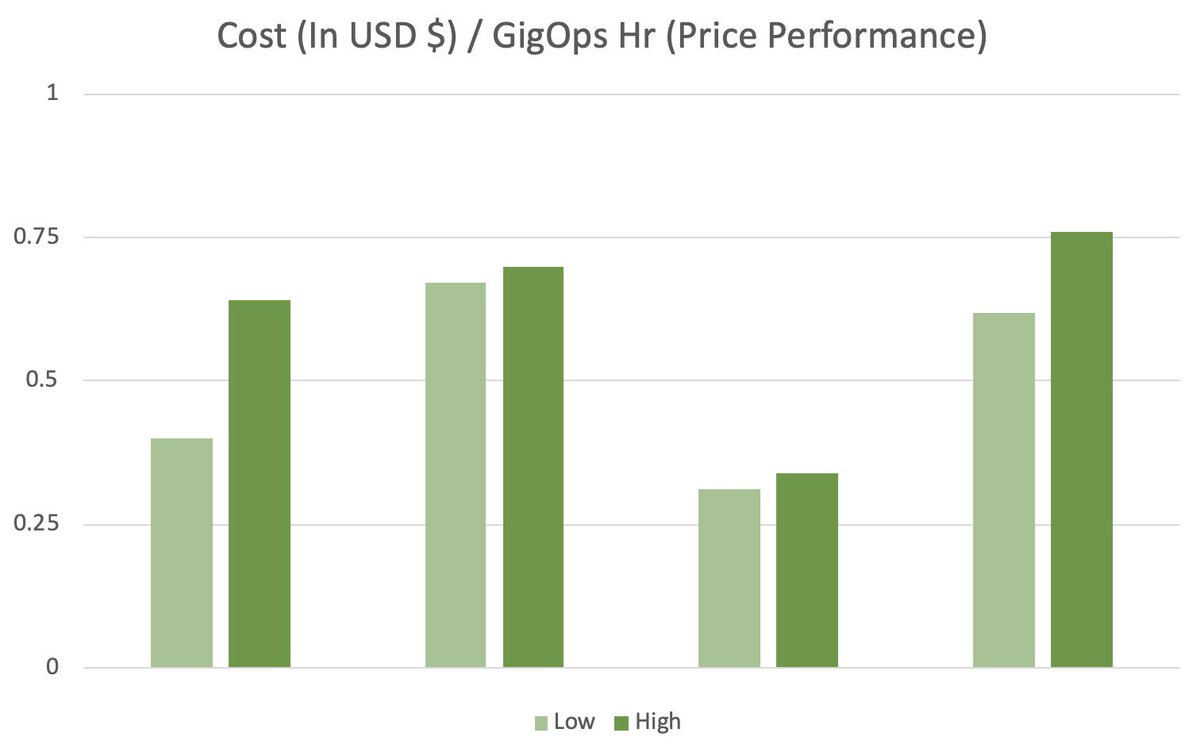
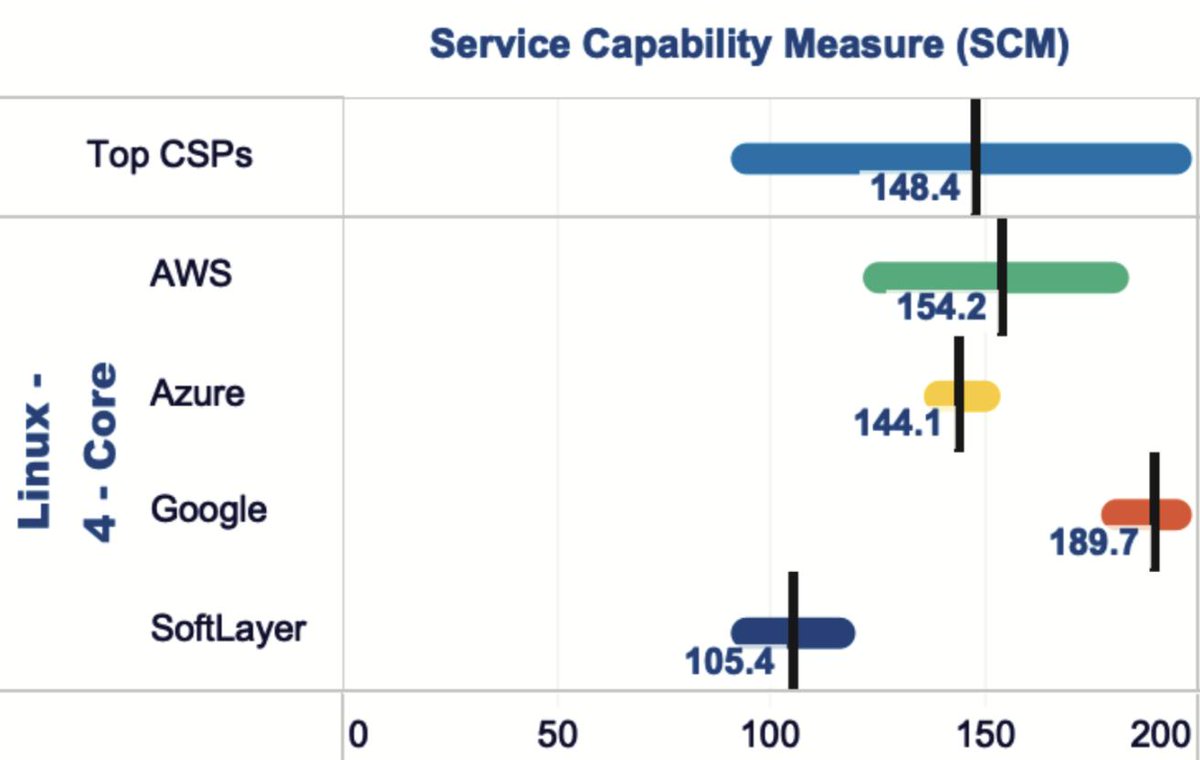
Following the recent smack down in performance of our latest blog, Google Cloud is maintaining the victorious momentum. When it came to data from June 2019 from Linux 4 Core, Google has an exceptional Service Capability Measure ranking, but AWS & Azure were not far behind!
Round 1 of the Heavy Weight matchup is over. The overall capability of the Google Cloud environment appears to be 35% greater than that of Amazon Web Services when comparing SAPHana workloads across comparable offerings. Standby for who will win Round 2!
https://t.co/4g8pfQhmFG
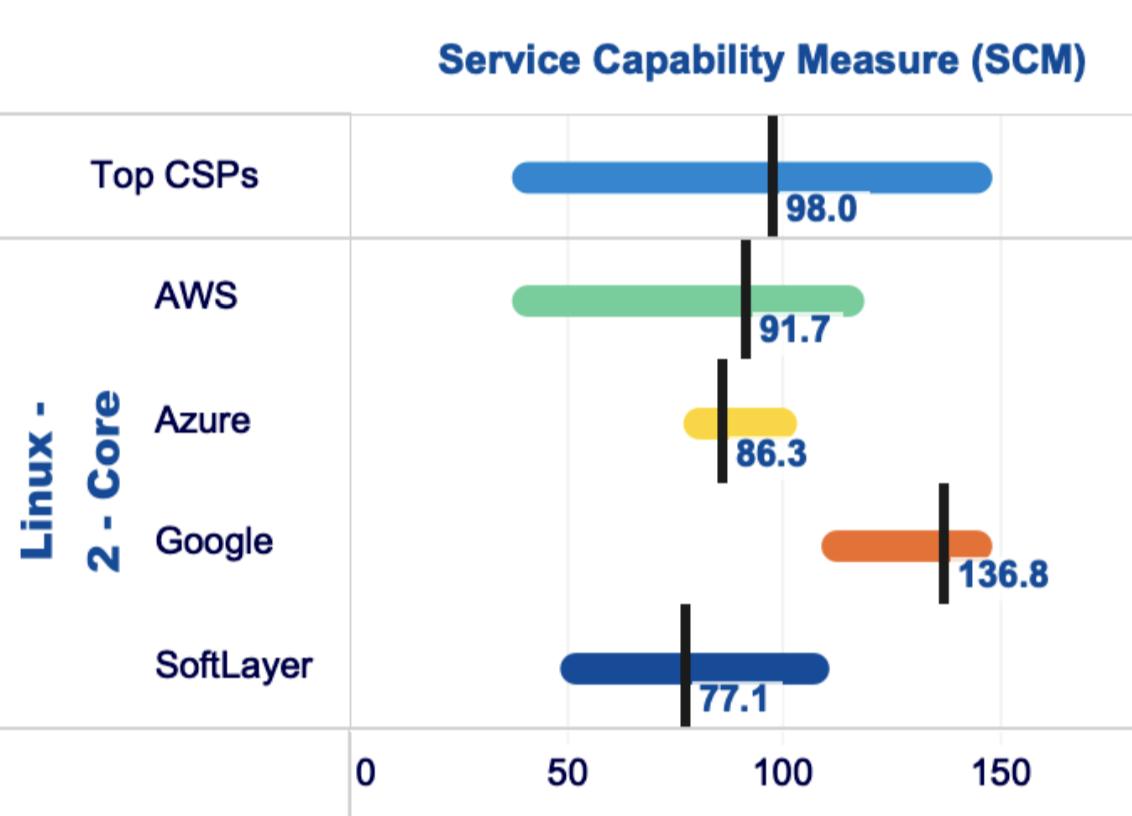
As we begin the June 2019 Service Capability Measure data groupings, it appears that the numbers are back to normal... Well, at least it appears normal for now...
#cloud#azure#aws#ibm#gcp#cloudqos#cloudperformance
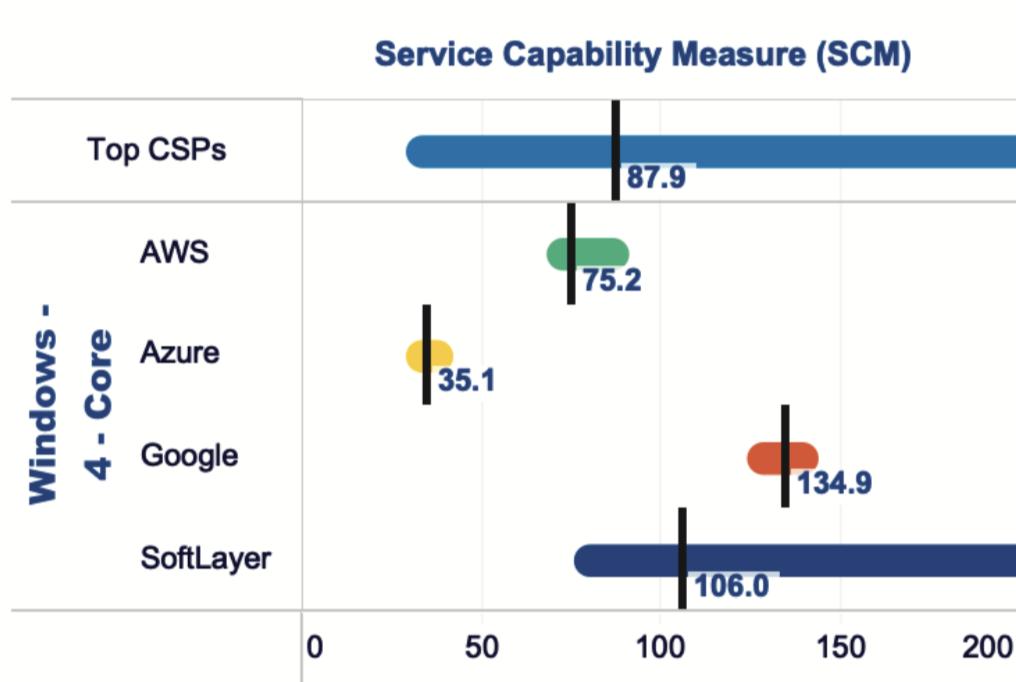
In our last post, IBM Softlayer was off the charts in our Service Capability Measure. Similarly, we have another Cloud Service Provider that was off the charts in Price Performance (Cost per GigOps Hr). We will give you a hint, it was not IBM Softlayer...
Off The Charts!!! In this weeks reveal, SoftLayer scored off the charts for their high end Service Capability Measure when running Windows 4 Core data.With that said, we still found massive variability, making it difficult for you to maintain consistent and reliable performance.
In May 2019 when running Windows 2 Core data we found one Cloud Service Provider to have absolutley no variance while the rest were as expected(with variance). Which provider achieved consistency this month? Is it the provider you currently use? Message us to find out more!
Check out our recent blog to learn about how we worked with SAP HANA BW benchmarks to establish a synthetic workload which was deployed to the cloud to quickly and efficiently measure the capabilities of two cloud providers.
https://t.co/XgsSw3AySe
SAP in the cloud is becoming a goal for many organizations. Due to the importance of the workload, the need to understand underlying capability within each environment is extremely important.
https://t.co/XgsSw3AySe
May 2019 Data for Linux 4 Core shows a little less variability for some providers that normally experience larger differences between low and high prices/performances. With that said, Some had an increased variability between high and low price performance. #Variability
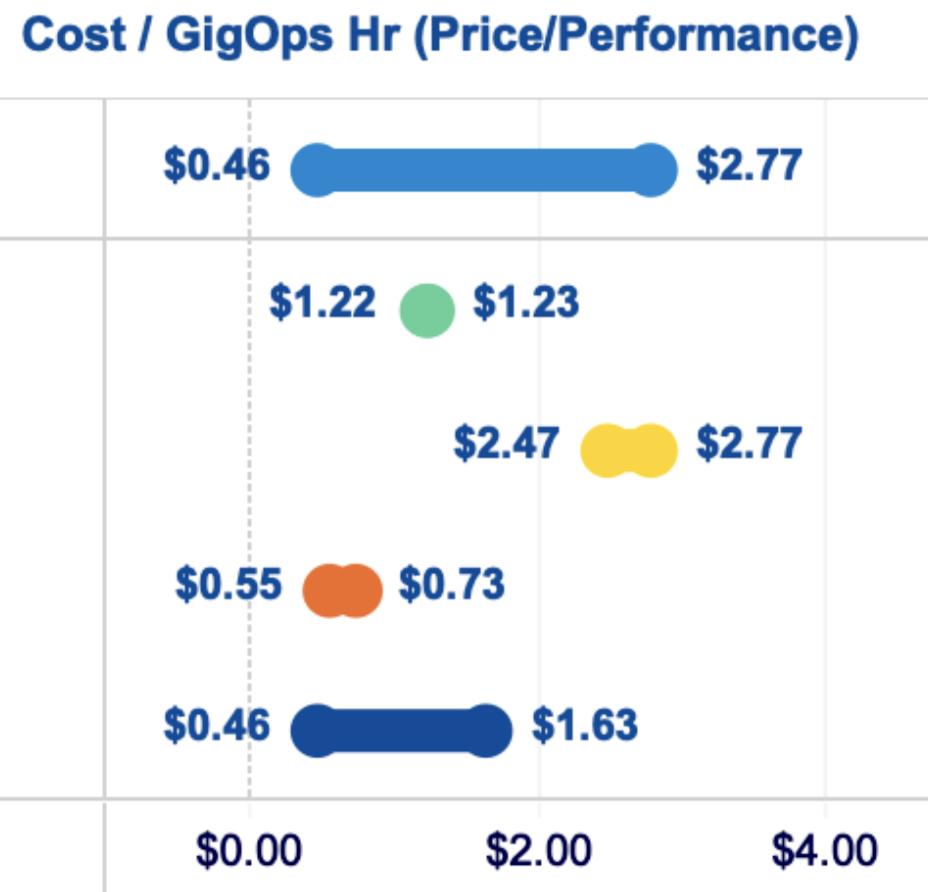
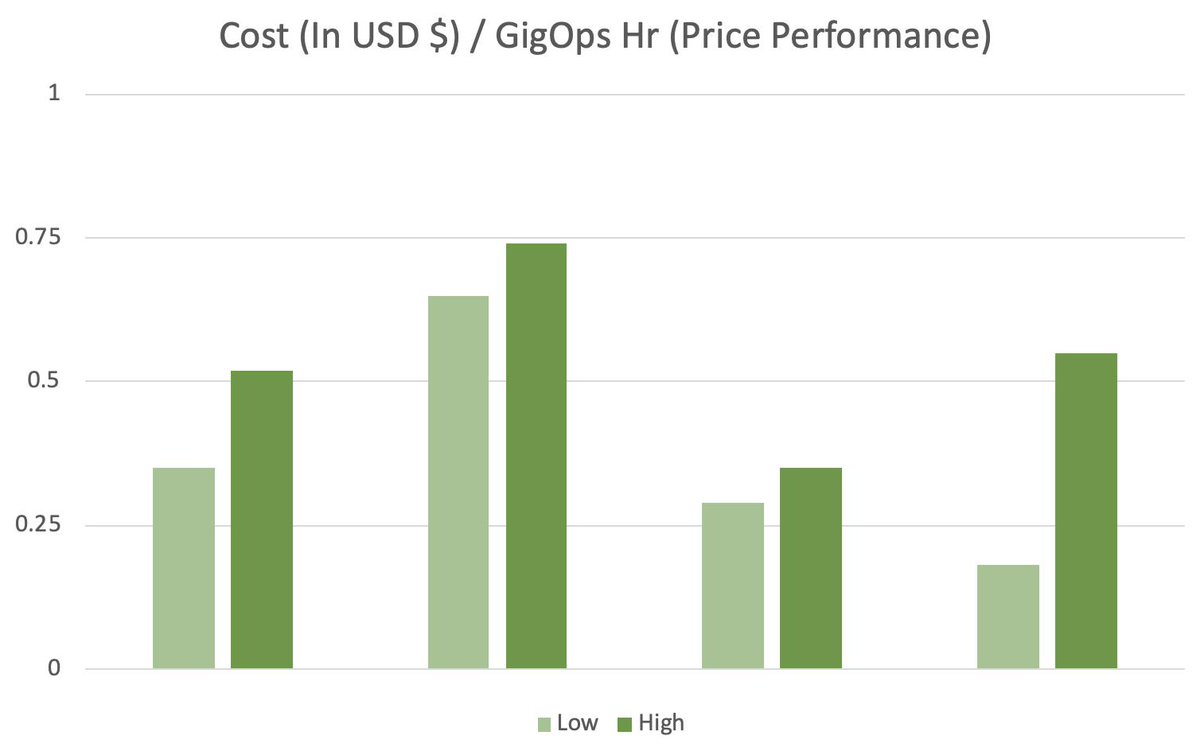
Data driven decisions can be the difference between success and failure. Given this data from May 2019 on Linux 2 Core servers, which stack would you recommend? We leave this anonymous on purpose. Do not get distracted by names and brands, let's focus on the actual data.
Data driven decisions can be the difference between success and failure. Given this data from May 2019 on Linux 2 Core servers, which stack would you recommend? We leave this anonymous on purpose. Do not get distracted by names and brands, let's focus on the actual data.