$31 MILLION HOTEL. EVERY PIPE AND WIRE MAPPED IN ADVANCE. BUILT BY TYPING SENTENCES INSTEAD OF PLACING THEM BY HAND.
A 190-room hotel needed its ductwork, plumbing, electrical, and fire suppression modeled and coordinated before construction could start.
The design team connected Kimi K3 to their modeling software through MCP, then had it read photos of the blueprints alongside plain English descriptions of each system and build the model directly instead of placing every component by hand.
Old process: 3 engineers, 6 weeks, around $47,000.
New process: 1 engineer confirming the AI's output, 9 days, roughly $10,500 combined, engineer's time plus AI compute.
Coordinated models finished this way cut change orders by 60 to 80 percent once construction begins.
See the article below for a smaller example of the Kimi K3 + Blender MCP workflow.
The UN estimates there are roughly 4 billion buildings on Earth.
Researchers recently released the first open dataset providing 3D models for 2.75 billion of them at 3m resolution.
GlobalBuildingAtlas maps individual building footprints, height estimates, and simple 3D building models at global scale.
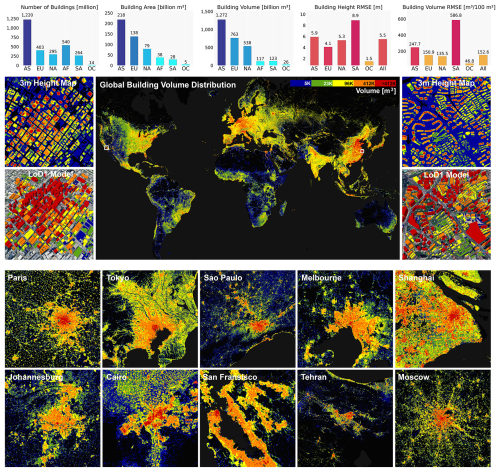
The numbers are absolutely enormous: 506.64 billion square metres of building area, 2.85 trillion cubic metres of building volume, and 2.68 billion LoD1 building models. More than 97% of mapped buildings have an estimated height.
Until now, global building maps had a major blind spot. They could often tell us where buildings spread, but they were much weaker at showing how much built capacity those buildings actually contained.
That distinction matters because cities grow in three dimensions.
A dense informal settlement and a planned mid-rise neighbourhood can occupy similar space on a satellite image. In a flat map, both may appear as “built-up land”. On the ground, they can mean very different things for housing, infrastructure demand, energy use, disaster risk, and economic activity.
GlobalBuildingAtlas tries to capture that missing third dimension.
The researchers used PlanetScope imagery at roughly 3 metre resolution, then combined several footprint sources, including OpenStreetMap, Google Open Buildings and Microsoft Building Footprints. For height, they trained deep learning models using LiDAR-derived reference data from 168 urban regions.
The result is a global dataset that turns billions of buildings into simple 3D blocks.
The headline finding is the building count. The UN had previously estimated around 4 billion buildings worldwide. GlobalBuildingAtlas directly maps 2.75 billion. After adjusting for completeness, the authors estimate the true total is closer to 2.71 billion, with bounds from 2.64 to 2.97 billion.
That suggests the old global estimate may have been too high by more than a billion buildings.
The regional pattern is just as interesting.
Asia has the largest built environment by far: 1.22 billion buildings, 218 billion square metres of building area, and 1.272 trillion cubic metres of building volume.
Africa has around 540 million buildings, more than Europe and North America by count. But its total building volume is only 117 billion cubic metres. Europe has fewer buildings, around 403 million, but 763 billion cubic metres of building volume.
That gap is the difference between counting structures and measuring built capacity.
The same logic shows up at country level. Countries with the highest building volume per person are mostly in Europe. Countries with the lowest are mostly in Africa. Finland has the highest building volume per capita in the dataset. Niger has just 0.36% of Finland’s level, and 27 times less than the global average.
That turns building volume into a useful proxy for development.
The authors test this directly. Building area per person has a 0.76 correlation with GDP per person. Building volume per person has a stronger 0.85 correlation.
They also compare country rankings across 20,301 country pairs. Area-based rankings agree with GDP per person 79.6% of the time. Volume-based rankings agree 83.5% of the time. Adding height gives 788 additional correct pairwise rankings.
In simple terms, the third dimension improves the signal.
There are limits. The model has weaker validation coverage in Africa because high-quality LiDAR reference data are scarcer there. It can also underestimate some high-rise areas, especially where building forms differ from the training data. The authors are open about these constraints.
But the direction of travel is clear.
For years, satellite-based development analysis has relied heavily on night-time lights, roads, land cover, and flat measures of built-up area. GlobalBuildingAtlas adds a more physical measure: the volume of the built environment.
That could change how we estimate housing capacity, infrastructure demand, urban density, disaster exposure, and climate risk in places where local administrative data are weak.