Love my family and friends. I am an entrepreneur - Mortgage Banking; HMDA. Born and raised in Bulgaria. Working, living in the US. Painting as a pastime.
I keep hearing this - You don’t need mortgage market intelligence tools anymore. Just ask Claude or ChatGPT. Especially when the underlying data, like HMDA, is public.
So I decided to test it.
One mortgage data question. Three tools. Three very different outcomes.
The longer version is on YouTube: https://t.co/ETTSQdT9yJ
Median property values for manufactured home purchase mortgages secured by real estate: $150,000 in Illinois to $415,000 in Washington, 2025.
Only 37.3% of buyers finance with a mortgage. The rest pay cash.
81,138 originations. HMDA via HMDAVision.
https://t.co/ArDlZJIRao
The average agency purchase loan rose from $233,409 in 2018 to $360,320 YTD 2026.
But 70% of that increase had already happened by 2022. The loan-size tailwind behind purchase dollar volume has weakened.
Explore the refreshed Polygon Pulse:
https://t.co/Fh1stJv3MT
How big is the multigenerational housing market?
5.1M households under the Census definition of 3+ generations.
6.4M adding skipped-generation households.
26.7M adding all shared adult generations, about 1 in 5 US homes.
Same data. Different question.https://t.co/gjaakcU5P7
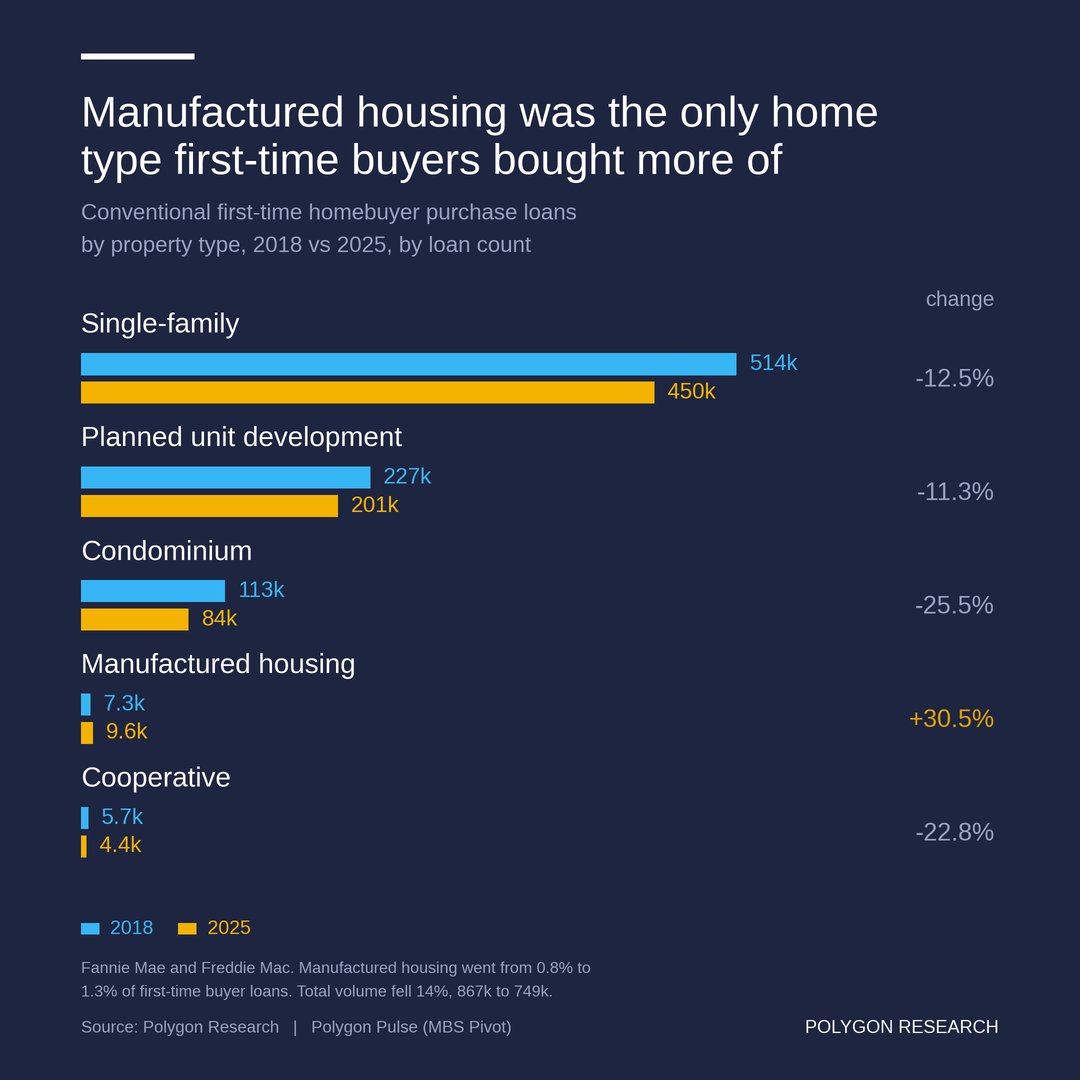
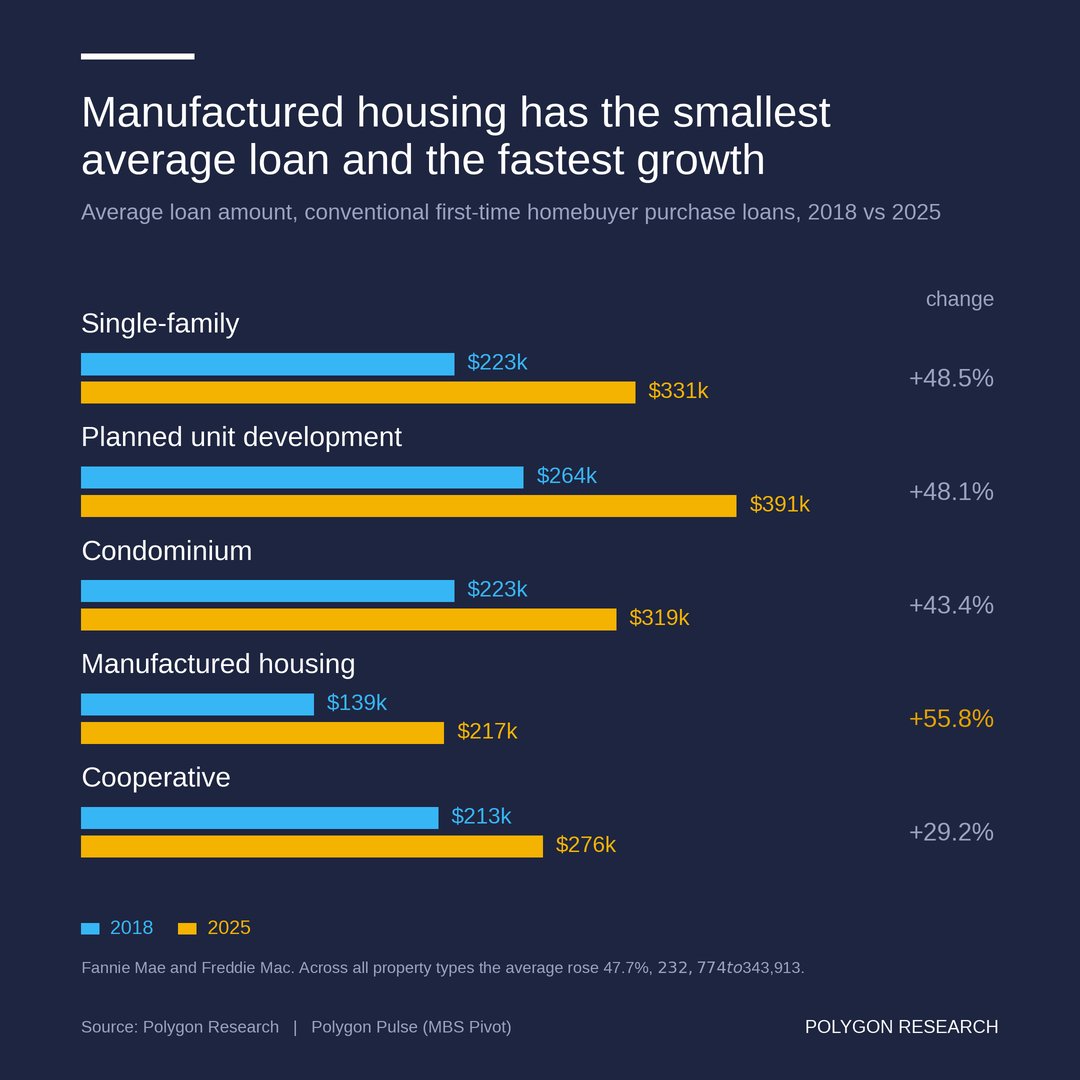
Manufactured housing was the only property type conventional first-time buyers bought more of in 2025 than in 2018. Up 31% in a segment that fell 14%. MBS Pivot.
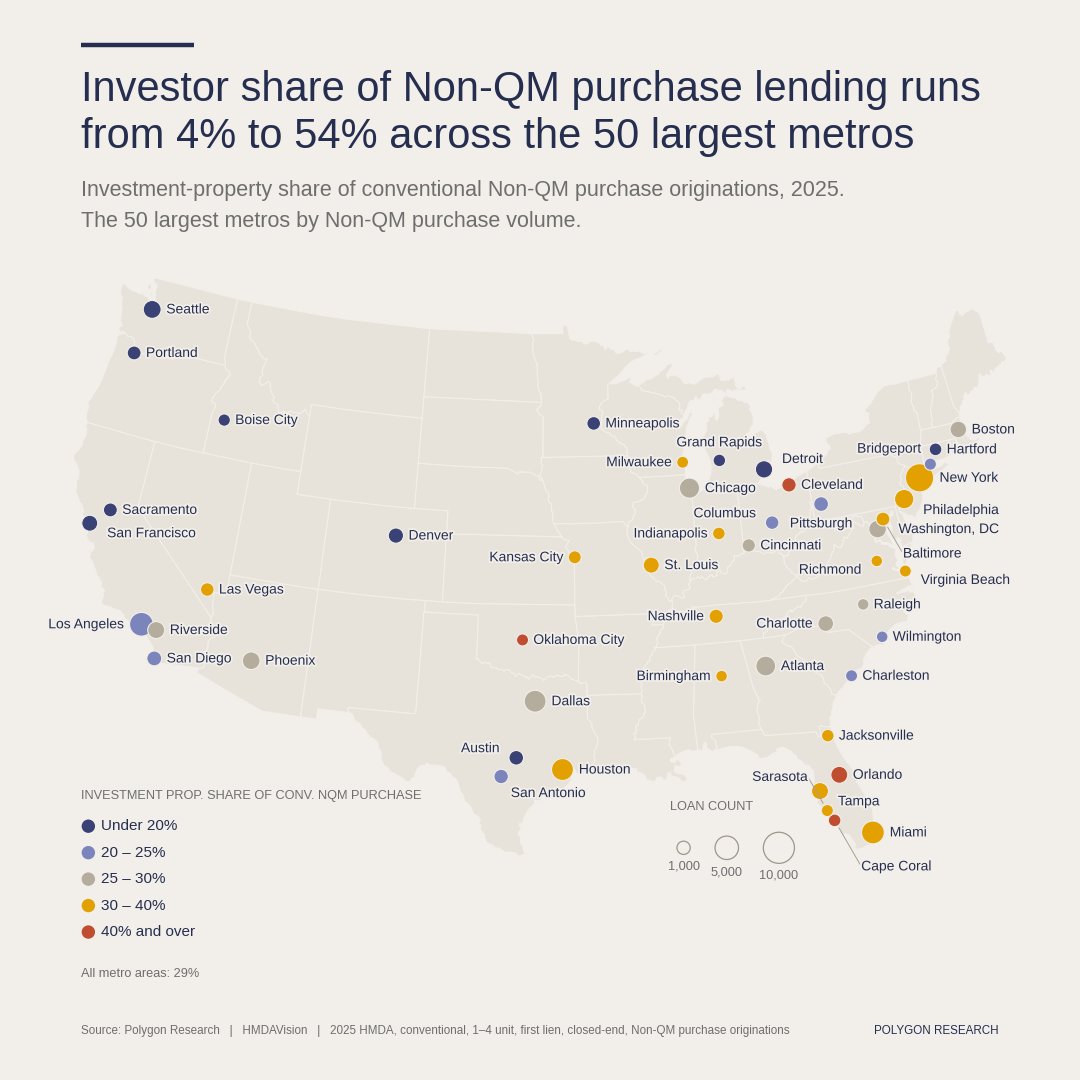
Investment-property share of Non-QM purchase lending, 50 largest metros, Range: 4% to 54%. Conventional, 1–4 unit, first lien, closed-end, Non-QM, purchase. 2025 HMDA. HMDAVision.
Where is mortgage opportunity forming—and who is capturing it?
Polygon Pulse connects community data to actual Fannie, Freddie and Ginnie originations, plus the lenders and brokers behind the volume.
July update: https://t.co/uA3uQfPqZZ
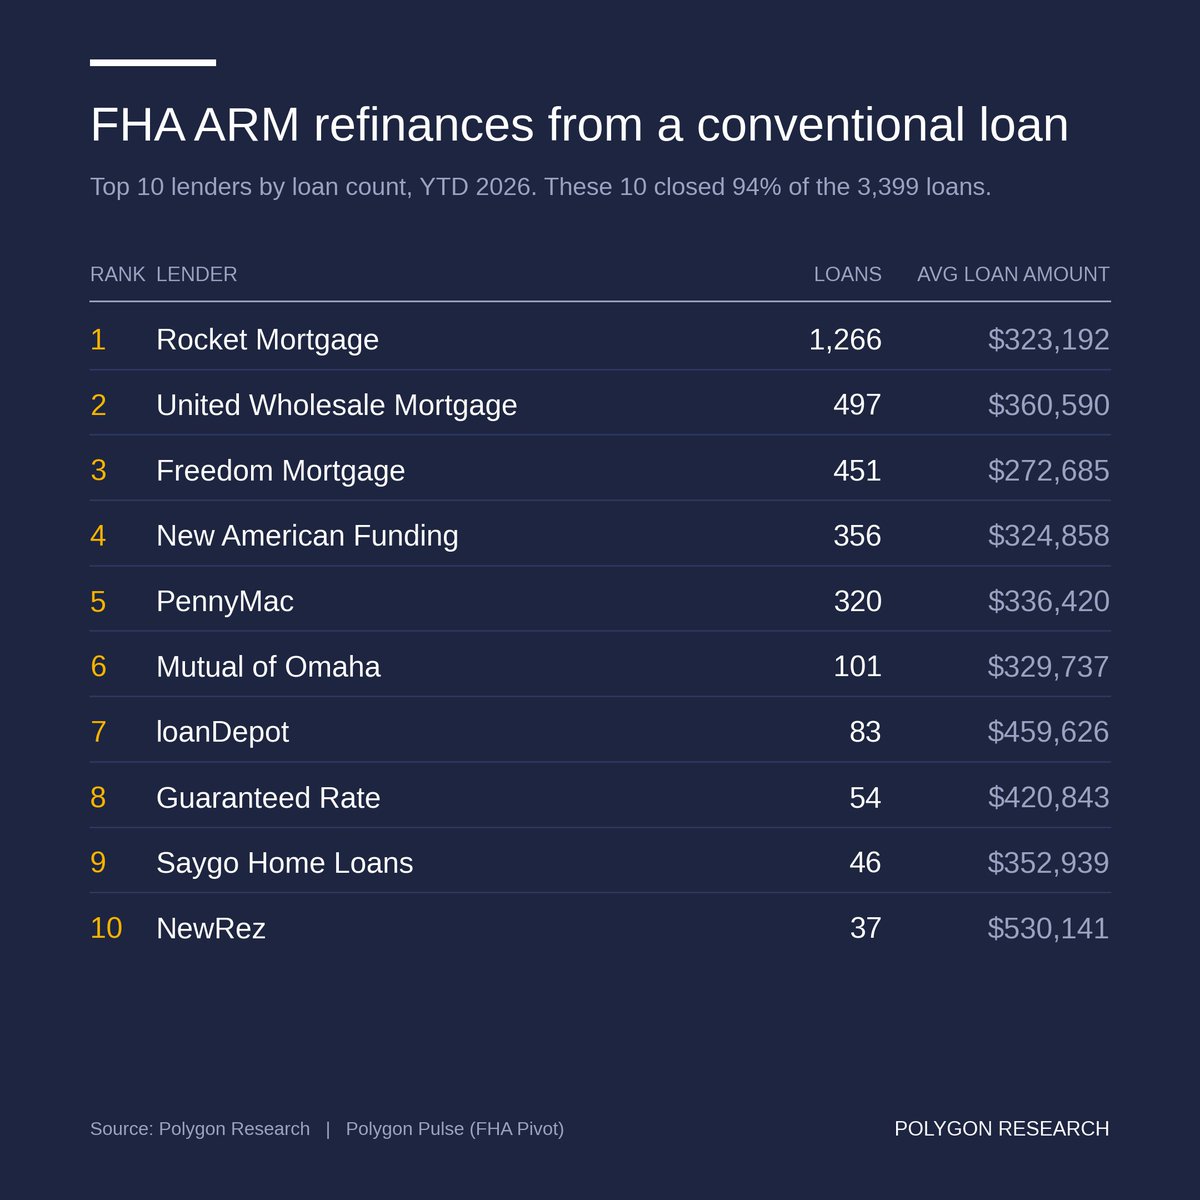
FHA ARM refi activity is hard to ignore. FHA endorsed 3,461 in May—more than all of 2017. From Jan–May, ARMs were 7.2% of FHA refis, up from 0.2% a year ago. The top 10 lenders accounted for 94% of volume in both borrower paths.
https://t.co/zj88ohfnwy
250 years.
A country built and carried forward by ordinary people, families, neighborhoods, and communities.
Happy Fourth of July from Polygon Research.
Today, a different question.
Conventional purchase loans only — Fannie Mae and Freddie Mac — share above 95% LTV:
Nebraska 18%, Missouri 16%, Indiana 16%.
LTV is one dimension — credit score, DTI, and pricing sit behind it in MBS Pivot.
Nearly 700,000 funded loans.
About $239B in origination volume.
That is what Polygon Research identified using our loan-level Non-QM classification algorithm on 2025 HMDA data.
But Non-QM is not one market. The opportunity looks different by county, borrower segment, and lender footprint.
Full analysis:
https://t.co/wwvSqEY1oo
#NationalHomeownershipMonth #NonQM #MortgageData
In 8 states, at least half of 2026 homebuyers put less than 5% down. Mississippi: 61%. New York: 22%. Massachusetts: 20%. A 3x regional spread, from loan-level Fannie, Freddie & Ginnie data. MBS Pivot, through May 2026