The Compute Economy follows AI bottlenecks: chips, power, data centres, credit, and the companies around them.
For investors and operators who want to see where pricing power goes next. https://t.co/OIfcAgSYtM
Dwarkesh Patel's case for compute getting 10x more expensive holds up. He just never asks whether you can hedge it.
So I did.
Scarcity attaches to capability. Depreciation attaches to hardware. The contract listing 5 October references the second one. https://t.co/G3bzFZ7UbL
Most AI debates stop at lab demand. The economics continue upstream.
When a lab earns more from each MW, it pushes up the price of compute, power, and financing. The bottleneck moves, and the margin moves with it.
That is the argument below.
The Compute Economy follows AI bottlenecks: chips, power, data centres, credit, and the companies around them.
For investors and operators who want to see where pricing power goes next. https://t.co/OIfcAgSYtM
The Compute Economy follows AI bottlenecks: chips, power, data centres, credit, and the companies around them.
For investors and operators who want to see where pricing power goes next. https://t.co/OIfcAgSYtM
You say it yourself in the second paragraph, short futures as a hedge, and long story short that's really the whole thing.
Latest COT, 25 August: leveraged funds net short 7.0m Treasury futures contracts from 2s out to Ultra Bond, and asset managers net long 9.4m in the same contracts in the same week. That's the shape of a paired trade rather than a market betting on higher yields, and if you're short the future against cash bonds then a rally moves both legs. Nothing there to squeeze.
And it isn't stretched, it's been shrinking. That net short was 9.1m a year ago and 8.4m in February, so about a quarter smaller than last August and well off the 9.5m peak in September last
year.
The premise is wrong. Nvidia doesn’t absorb 0 P&L here: $ 7.77bn of equity gains in Q2, $ 23.71bn in H1, through Other income. Note 6 already identifies the VIEs, $ 4.7bn max loss exposure, not primary beneficiary. The real exposure is the reverse: 16.8% of H1 pre-tax income is marks that can reverse.
The three numbers are real, but the maturity table sits two pages away and it changes the sentence about bills.
Of the $ 530.5bn, what's actually due this fiscal year is $ 120bn, and trailing twelve month operating cash flow is
about $ 134bn. The $ 22.4bn is one line of the balance sheet, because next to it sit $ 77bn of marketable securities.
And the $ 105bn guarantee can't come due at all yet. It was signed in August, after the quarter closed, it only triggers
on an OpenAI default on defined lease and power payments, and the first phase starts in fiscal 2029. A guarantee signed in August also didn't book any of July's revenue.
The part of that section actually worth watching is smaller. In 2022 Nvidia took $ 2.17bn of charges against a $ 9bn peak in supply commitments. The same table now reads $ 279bn.
BBG terminal has a much broader dataset, with much more reliable data from providers like institutional players like banks and brokers. It’s a full stack professional platform with a wide range of proprietary data that not a single name listed in Aravind’s post can replace.
Bloomberg has a moat which is fueled by its participants and users, the day they will stop using it, then BBG terminal could be replaced, but I see as of now 0% probability for such scenario to happen
Since January dealer holdings past 11y are up $ 12.2bn while the rest of the book is down $ 24.4bn, so what looks flat is really a move into the long end. On the January to August average that bucket went from $ 72.6bn to $ 120.1bn.
On spreads, the Dallas Fed reckoned in February that AI borrowers swapping floating rate credit to fixed "ought to richen Treasuries relative to swaps", and Treasury supply does the opposite. If both are running, flat is what cancelling
looks like.
Pretty much the same, but not exactly, it's even more interesting looking at the gap acrually because they do trade. Every deferred month has done between 16,000
and 57,000 contracts over its life across the 4 monthly series, bar September 2027 which has only just listed, so it isn't exactly a dead board.
According to data it's that nothing has happened lately. In the last 24 hours the front month alone did 5,224 while all 12 deferred months put together did about 2,000...
And volume isn't quite the same thing, because one can print size and still have nobody take the other side of the maker, andyou can easily spot it by looking at the width, which roughly doubles by the back of the curve and stays there.
So yes, mostly what you said, but I'd put it as "stale" rather than untraded.
CME lists compute futures on 5 October.
A live compute market already exists. #Kalshi opened its first one on 26 March. I have not found the aggregate numbers published anywhere, so I pulled them off the public API myself.
36 series. 1,932 markets. 5,945,611 contracts traded.
Each contract has $1 notional. That is under $6m of dollar volume since the market opened.
Volume peaked on July expiries at 2,485,179 and has not been close since.
Yesterday 988 of the 1,160 live markets did not trade at all.
Price discovery is working. Size is not there yet.
---
Aggregation is mine, Kalshi public API, retrieved 14 Aug 2026.
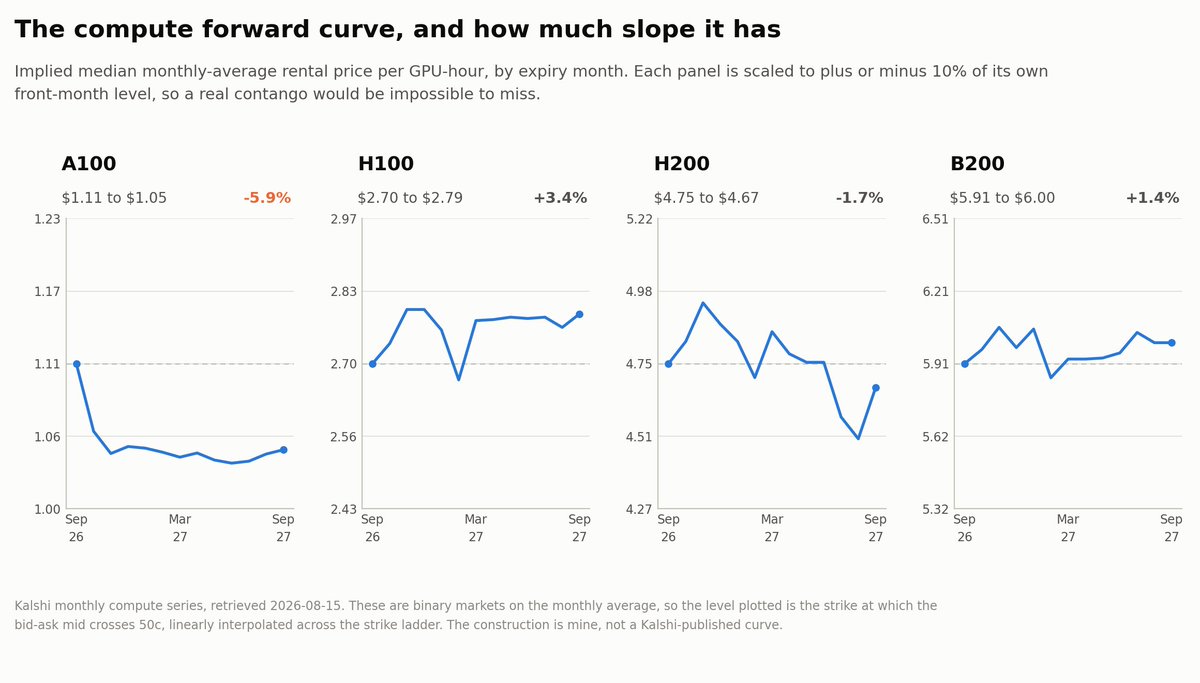
There's a forward curve and it's flat. H100 goes from $2.70 for September this year to $2.79 a year out, B200 from $5.91 to $6.00, H200 from $4.75 to $4.67, and A100 drifts down from $1.11 to $1.05.
They're binaries on the monthly average, so I took the strike where the bid-ask mid crosses 50c as the implied median, and the construction is mine.
You see there are 12 months of tenor and nothing in it: Apparently no scarcity premium, but not even collapse from new supply either. imho there are 2 ways to read that:
- either the market really thinks compute costs the same next September, which would be worth knowing,
- or there's nobody there to say otherwise.
According to the spreads the answer points at the 2nd one, because the front month is about 2c wide while the far months are 6 to 8, and that's on a $1 contract.
The back of this curve is a market maker's quote that nobody argues with... we'll find out on 5 October, when CME's contract gets traded by different people through different pods. If that curve has a shape, the flat one was just absence. If it comes out flat too, then flat is the answer.
Seat is the better analogy, and there's already a traded
number to check it against.
Kalshi has been running GPU compute markets since 26 March, 36 series and 1,932 markets, so I pulled the volumes off their public API this morning.
5,945,611 contracts since inception, but each one is $1
notional, which puts it under $6m of dollar volume since it opened. And 988 of the 1,160 live markets didn't trade at all yesterday.
So there's plenty of price discovery, tho no size behind it.
@itslennyj@HedgieMarkets It's even worse cause nobody is gonna turn up in your yard at all, there's no physical delivery leg in the contract.. It just cash settles against a monthly average of an index. The only thing that arrives is a wire 🧐
@HedgieMarkets Wheat has the one thing this contract doesn't: if the price goes silly, someone turns up with a truck.
No truck here because it cash settles on an index average, so the only discipline is whoever calculates the index.
The rest of the work is below: CME contract mechanics, the five kinds of basis, what it costs, and why hedging the electricity instead does not solve it.
https://t.co/Qw7X9P2RLb
A compute future is 730 GPU-hours, listing 5 October.
you'll get public forward price for compute power hedging, which didn't exist 18 months ago.
Whether you can hedge with one is a different question, and you have 5 kinds of basis risks to price. https://t.co/8oPTQVDvWu
Terms 1 to 4 all have a published number this quarter. Term 5 has a ratio.
"Production inference workloads more than tripled" is a workload count, rather than revenue. So the one term that separates a strategic-partner business from a rental business is the one nobody outside can size.
CoreWeave doesn't break it out either.
I went looking in both Q2 sets: https://t.co/9uGOrbQLJT
CoreWeave and Nebius both reported this week.
Neither breaks out how much comes from renting GPUs and how much from selling software.
The entire neocloud argument turns on a line item neither company has ever put a figure on. https://t.co/uaDFsqB2Hc
A compute future is 730 GPU-hours, listing 5 October.
you'll get public forward price for compute power hedging, which didn't exist 18 months ago.
Whether you can hedge with one is a different question, and you have 5 kinds of basis risks to price. https://t.co/8oPTQVDvWu
CoreWeave and Nebius both reported this week.
Neither breaks out how much comes from renting GPUs and how much from selling software.
The entire neocloud argument turns on a line item neither company has ever put a figure on. https://t.co/uaDFsqB2Hc
IMHO is a bit more complex.
yeah, the burn is arithmetic. Cash from operations minus $ 9.4bn of capex gives you that before you know anything. The gap I see is in the tenors: it depreciated over 6 years, financed over roughly 5, contracted for about 3. The tail of the debt sits against capacity that has to be eventually re-let.
That's what the Nvidia mechanism is for: it pays after you've tried to re-lease the capacity or sell the chips, capped at 25%, on some deals.
Which leaves one variable carrying all the datacenter play: what compute is worth when those contracts come up. Spot GPU rates are published. The three year is not, and that's why the guarantee exists at all.