TAKE A LOOK AT THIS CHART!
Almost everyone is watching the price.
Smart money is watching this. 👇
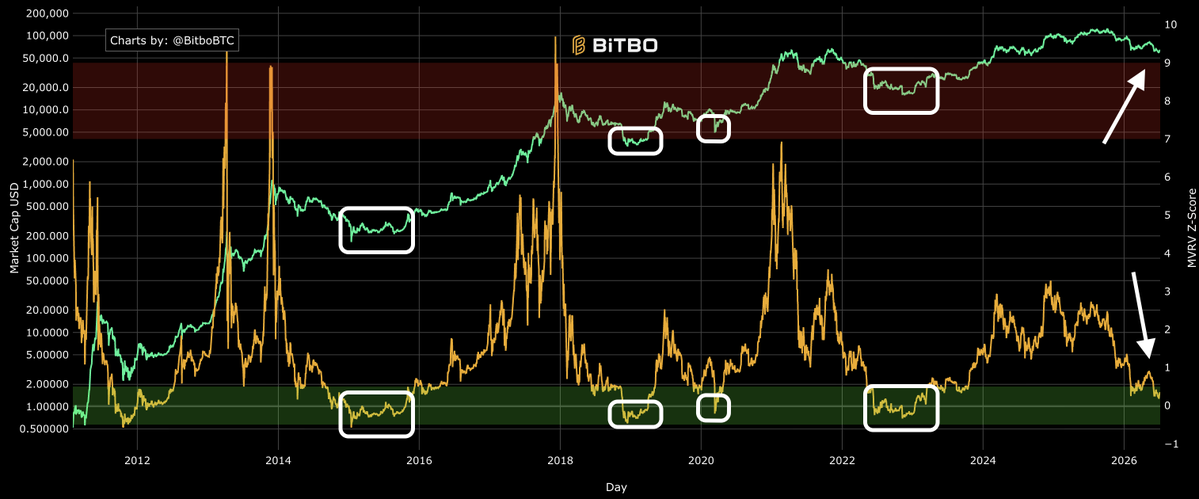
The $Bitcoin MVRV Z-Score is quietly returning to levels that have historically marked the transition from fear to opportunity.
Look at the highlighted zones.
• 2015 → months of boredom before a massive rally.
• 2019 → another accumulation phase.
• 2020 → one final reset before the bull market.
• 2022–2023 → the same story repeated.
Every cycle, the market convinced people that Bitcoin was "dead."
Every cycle, those low MVRV readings became the foundation for the next expansion.
Now compare that to today.
Price is holding relatively high...
...while MVRV continues to compress.
That's a combination we haven't seen often.
It doesn't guarantee an immediate pump.
But if history rhymes, this may be one of those periods that looks obvious only in hindsight.
Question:
Is this quiet accumulation before the next leg up...
Or is this cycle finally different? 👀
WOW. #Bitcoin has rejected the Short Term Holder Realized Price for the 4th time.
Every rally into this level has been sold.
Every rejection has led to fresh downside.
Why does this level matter?
It's the average cost basis of recent buyers. When Bitcoin rallies back to this line, many holders who have been underwater finally get a chance to break even - and they start selling, creating resistance.
If $BTC tests $68,000 be careful chasing longs.
You don't want to end up buying right into another rejection.
🚨 WARNING
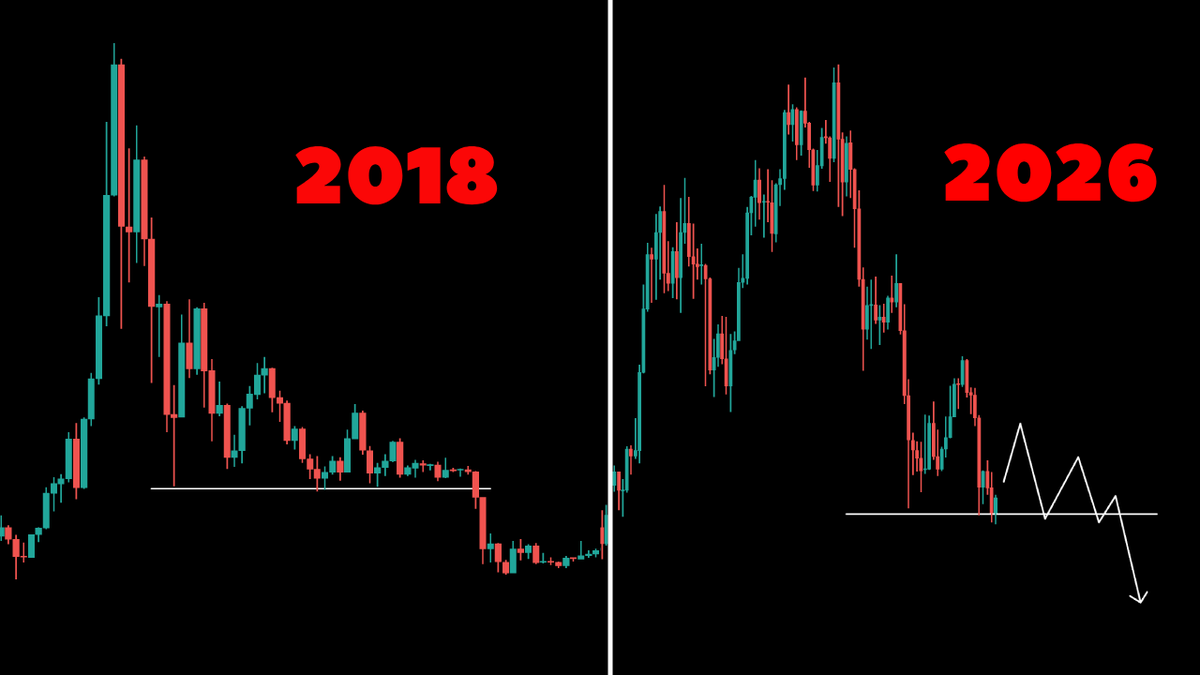
Almost nobody is looking at what happens if the cycle completes exactly as before.
The trendline highs have been respected with near-perfect precision.
Now there's only one question left:
Will the trendline lows be respected too?
If history continues to rhyme, $40k BTC is no longer an impossible scenario.
Most people will call it crazy.
Until the chart proves otherwise.
Bookmark this.
@seth_fin Why don't people just stick to spot?) Trade less, have patience, and make way more profit with minimal screen time. Futures traders are never outperforming spot holders in the long run. 99% of them just end up getting rekt
"WHEN IS THE BOTTOM, CARL?" 📉
Everyone is trying to catch the exact low.
But what if the answer is... already hidden in the math?
Here's what I found👇
Every $Bitcoin market cycle since the last halving follows a surprisingly similar timeline.
Cycle after cycle, the macro bottom formed around Day ~900 after the halving.
Today, we're only at Day 817.
❗️That leaves roughly 2-3 months before history suggests the highest probability window for the next major bottom.
Will history repeat perfectly?
Of course not.
But markets love rhythm, and #Bitcoin has respected its cycle structure more often than most people realize.
❗️Don't skip this chart❗️
I keep watching Bitcoin's MVRV.
Here's why it matters:
🔴 When MVRV drops below 1, the average holder is underwater.
Historically, that has marked the best accumulation zones of every cycle:
• 2011 ✅
• 2015 ✅
• 2018 ✅
• 2022 ✅
It doesn't tell you the exact day the bottom is in.
But it tells you when $Bitcoin is trading at levels that history has rewarded the most.
In this bearish cycle, the price hasn't yet entered the buy zone.
The most important thing is to wait patiently for the right moment and not rush into unnecessary actions.
🇦🇪🇺🇸 The UAE is reportedly building a new port that would bypass the Strait of Hormuz.
Why does that matter?
For decades, Iran's ability to threaten shipping through Hormuz has been one of the biggest geopolitical risks for global energy markets.
A viable alternative route changes the equation.
That's exactly the kind of macro backdrop risk assets love.
Sometimes the most bullish news for crypto isn't about crypto at all.
Am I connecting the dots... or is the market still sleeping on this?
😱 This chart genuinely scares me 😱
Not Bitcoin.
Not stocks.
Not the news.
The DXY.
For years, the Dollar Index has been one of the best macro indicators for risk assets.
📉 DXY down → weaker dollar → liquidity flows into risk → crypto, stocks, commodities tend to rally.
📈 DXY up → stronger dollar → liquidity tightens → markets often struggle.
Now look at the bigger picture.
The DXY has been trading inside an ascending channel since 2007.
It just bounced off the lower trendline.
If this breakout continues, we could be looking at a much stronger dollar... and a painful correction across risk assets.
I'm not saying it's guaranteed.
I'm saying it's one of the few charts I wouldn't ignore right now.
Am I overreacting, or is the market massively underpricing this risk?