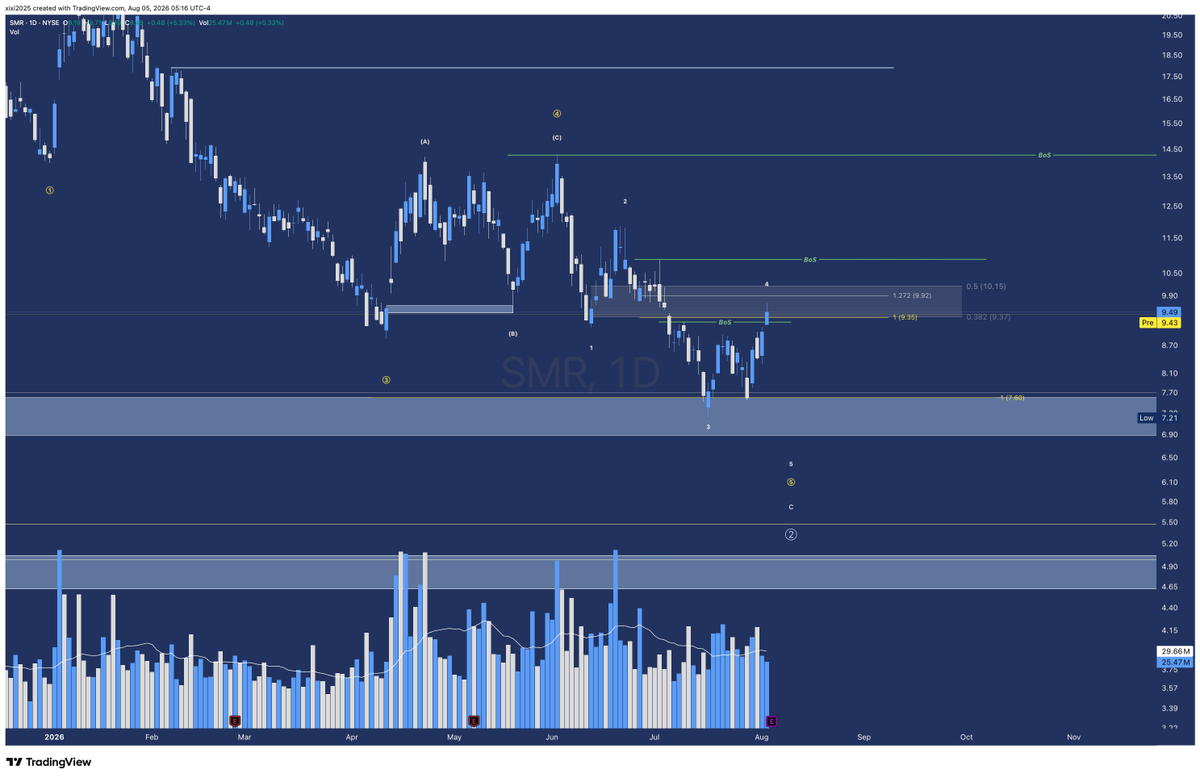
$SOFI I might have to change my mind on how this plays out over the next few months.
As much as I want it back in a bullish trend, the recent bounce still looks incredibly corrective to me. This chart is now my primary count.
$SOFI Weekly update:
There’s a solid chance we bottomed after the earnings dump. Only two levels really matter right now:
A decisive break above $19.5 starts the bullish trend — near-term targets $22 and $25, longer-term $46.
A close below $15 keeps the downtrend alive, with targets in the $13s or even $10s.
Yes, the consolidation will drag on and bore everyone. But if you didn’t panic-sell right after earnings, might as well sit back and let it cook.
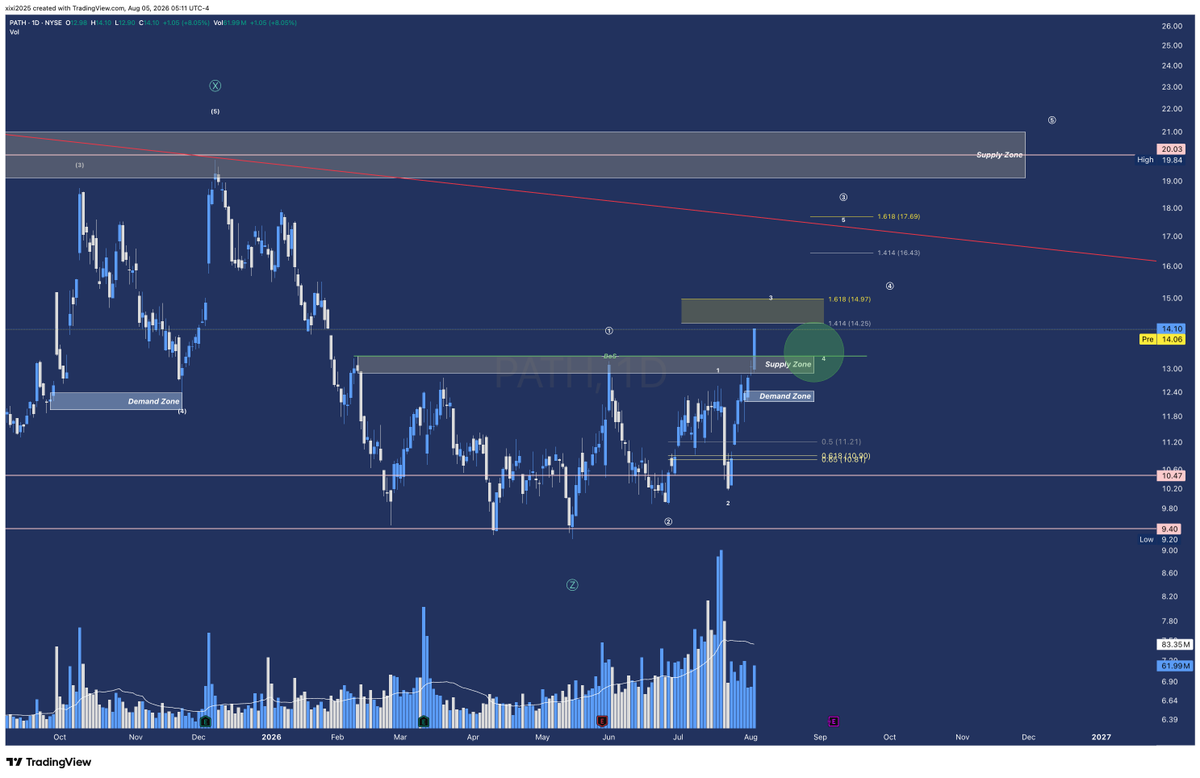
$PATH Nobody’s tweeting about this — and maybe that’s a good thing.
the stock has been in the accumulation phase for so long, peopel have gotten disappointed over and over.
On the daily, the next pullback needs to stay shallow if this is going to turn into an impulsive move. Otherwise it just becomes another ABC correction (which would be disappointing).
I’m betting this is finally the impulsive leg higher, time to see some sunlight.
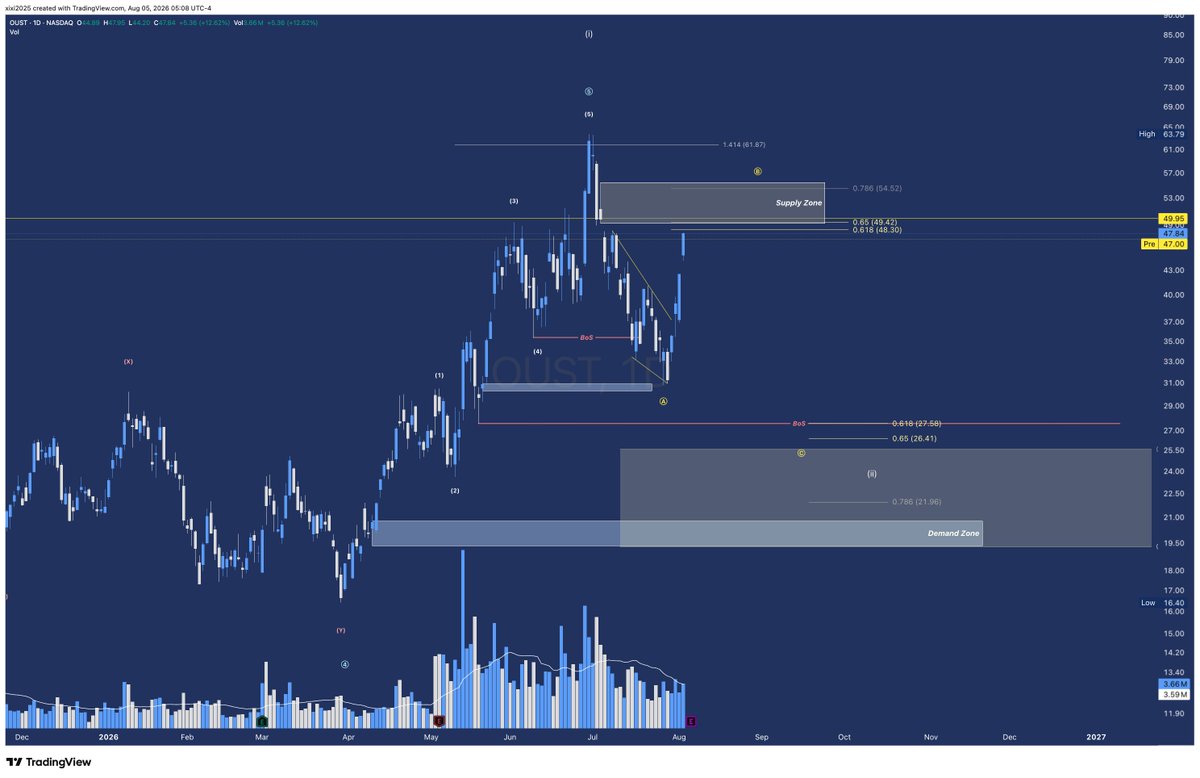
$OUST Earnings Thursday.
Still think one more low is likely. Was optimistic about the short from the 0.5 Fib retracement and it sliced right through it yesterday.
$OUST Weekly updates:
Price dropped into the pre-marked demand zone at $30 and bounced perfectly.
As long as it doesn’t break the upside structure at $41, I’m pretty convinced it’ll follow the corrective blue path. This correction still looks incomplete to me.
$RGTI Earnings Thursday. Make it or break it moment, Overall I think the low at $13 was cheap enough to start a position. But if it drops into the $10–11 range, why not add more?
$SOUN if the bottom is already in, the safe way to approach this is to see the break of structure at $7 level. Otherwise it would follow the yellow path.
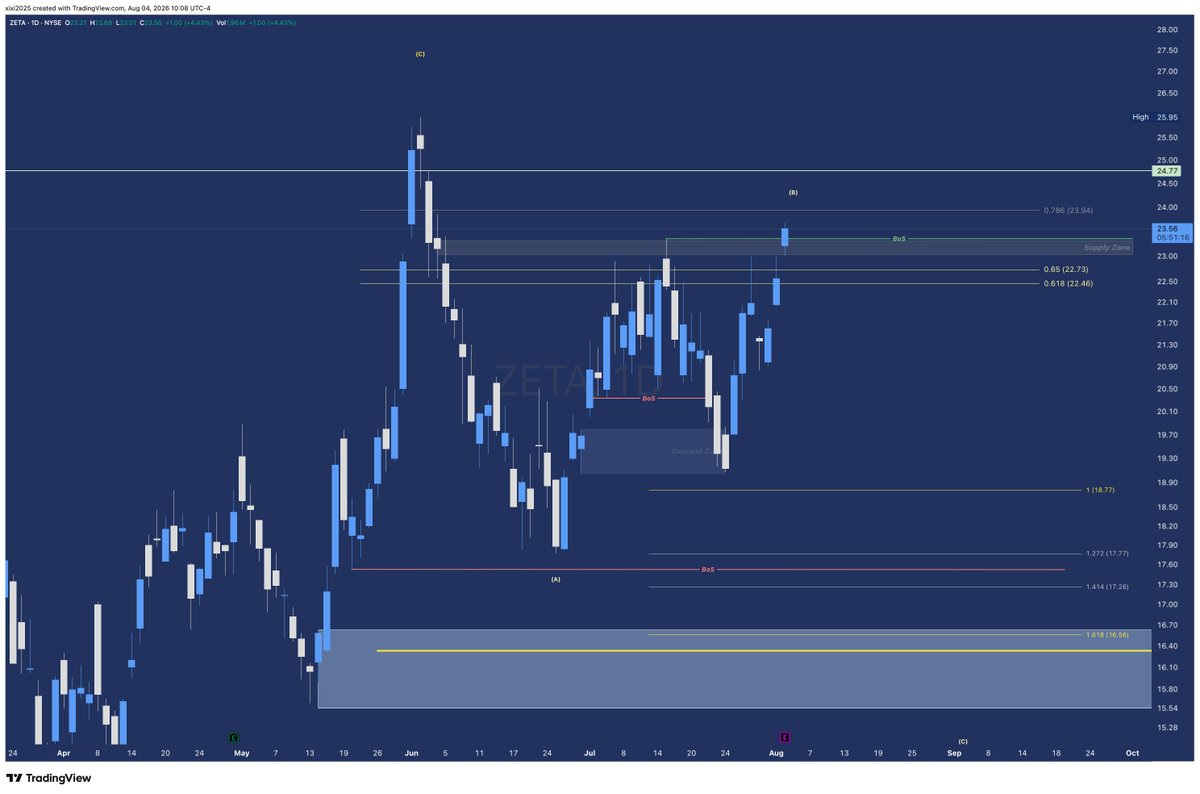
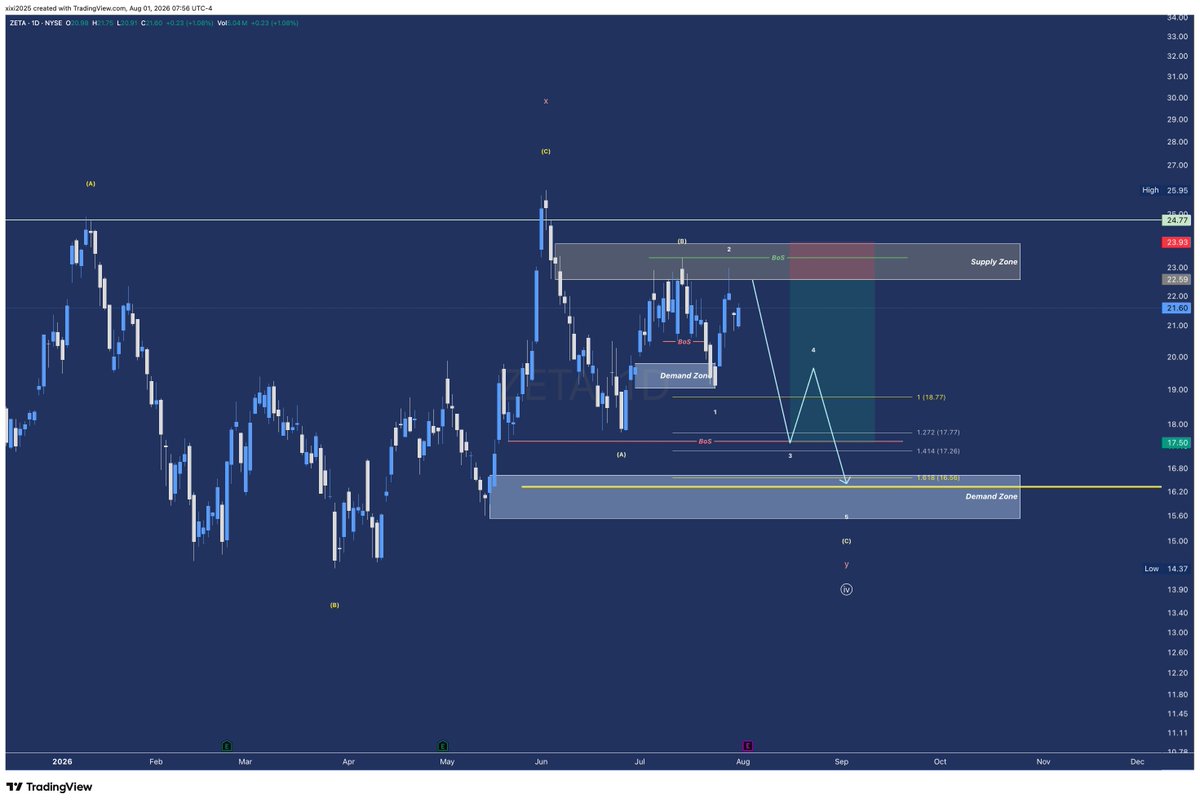
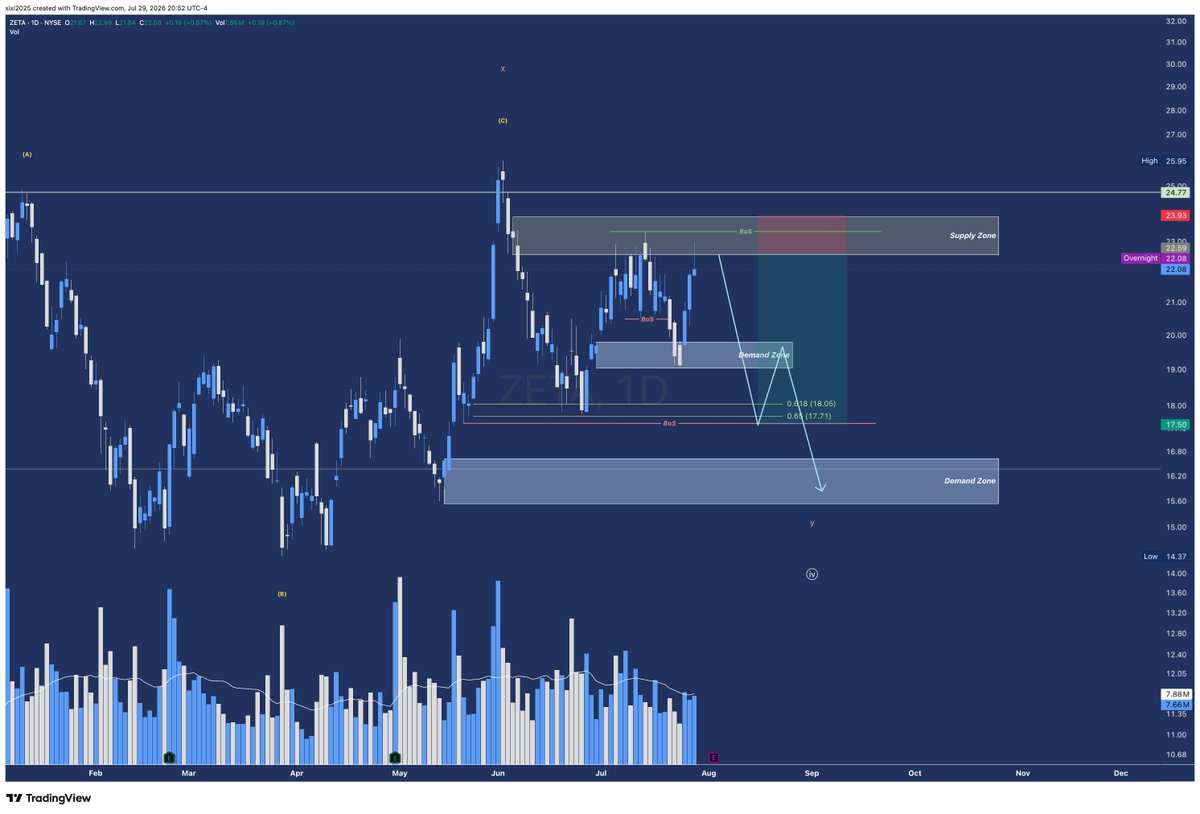
@fel_tip_pen Thanks very much, Felipe, short term noise will always be there, but according to the chart, I still have ZETA at 40s minimum, so PAYtience needed here, good luck
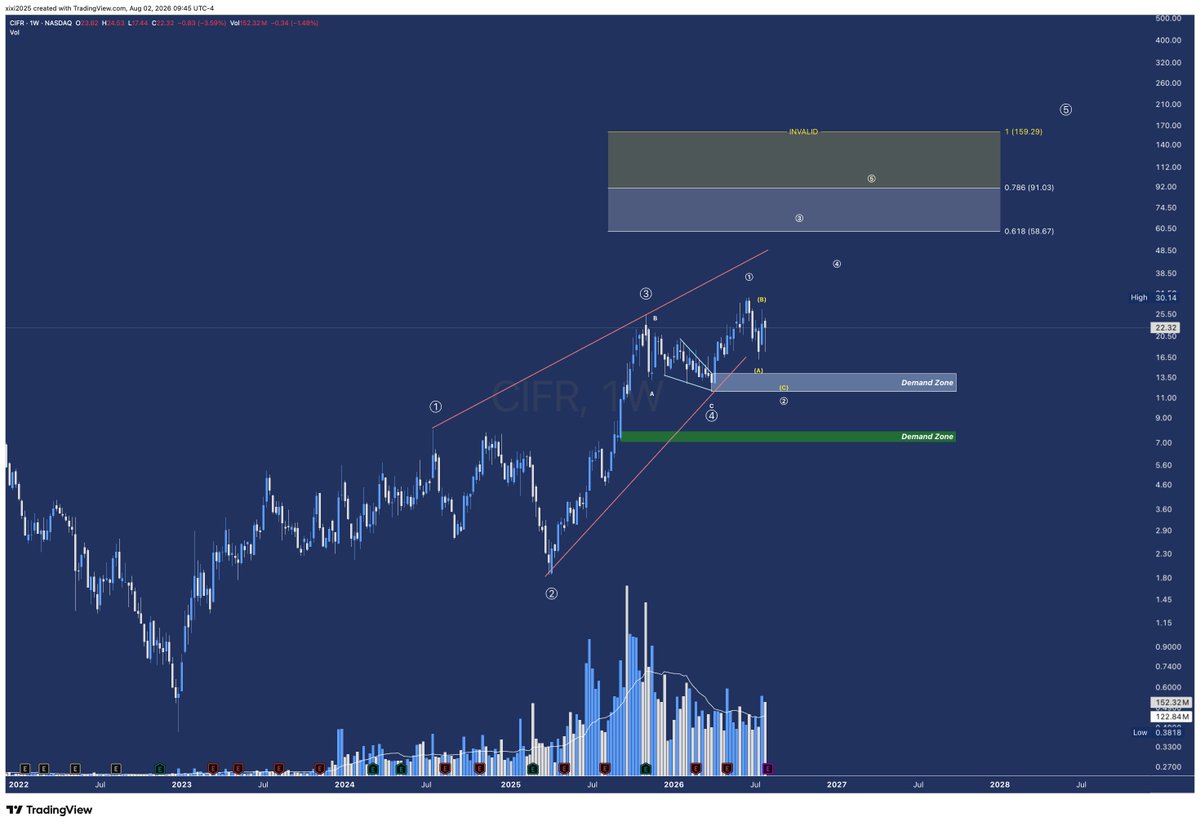
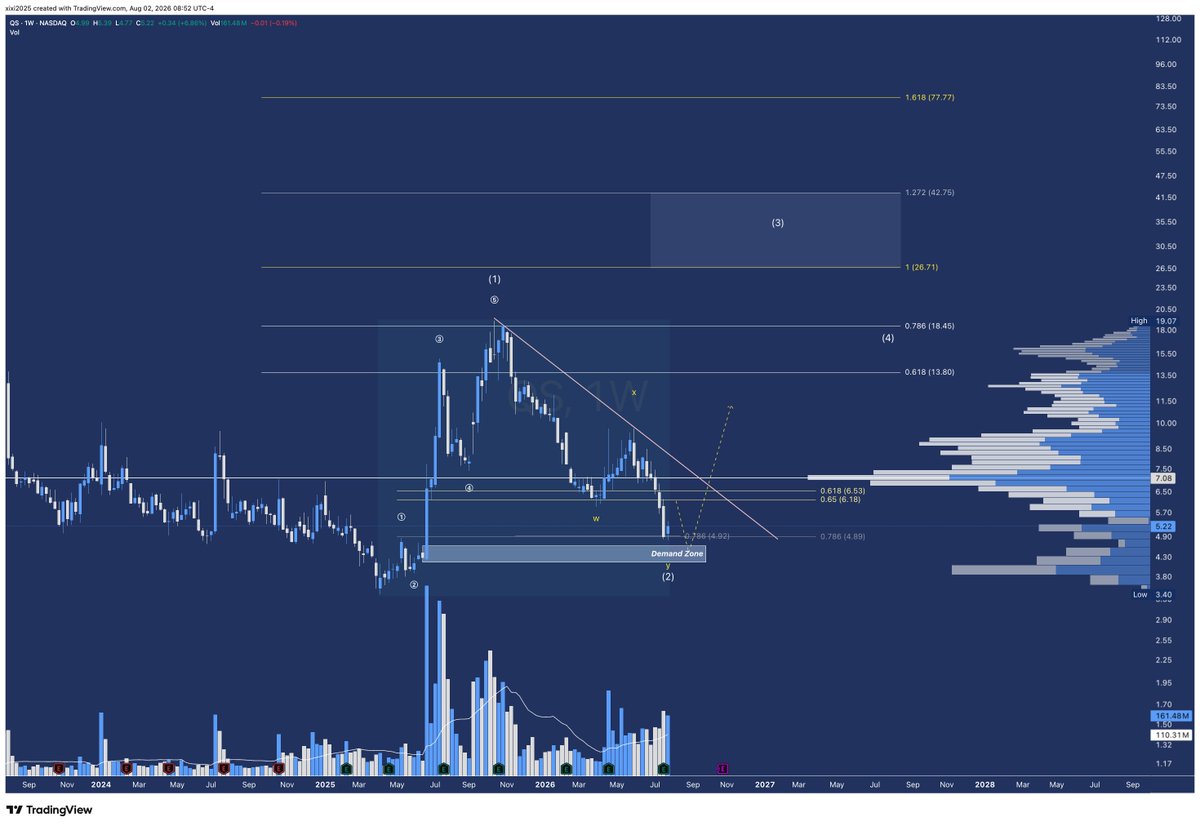
On the weekly, the price levels matter more than the exact line — it’s mainly to give a general idea of the long-term target, knowing it can take months to develop.
The daily chart better reflects the near-term price action.
For BTC, maybe one more low still. But BTC hitting ATH would be a plus for the miners/DCs, not a must for them to reach their targets. Thanks Ty