Welcome to Leapti.
A weekly stock research desk built to help traders find high-quality opportunities without scanning hundreds of charts.
Every weekend we:
✓ Review stocks
✓ Rank setups
✓ Define risk
✓ Track outcomes
Research. Decide. Invest.
🌐 https://t.co/fDfnRoi9PA
@USA__Capitalism If I was looking to take a long/swing position,I would wait for a a draw back to the gap fill line,that’s were I would be willing to take a position,and I would be using a daily candle close below the gap fill as a stop loss
$NBIS chart update
Probably one of the cleaner charts on my watchlist right now.
The breakout above resistance finally came through, price tagged a new high around $298, and now we're seeing some cooling off after the run.
Honestly, if I was bullish last week, I have even less reason to be worried now.
The key thing I'm watching is whether the old resistance zone starts acting like support. If it does, this pullback may end up being nothing more than a healthy reset before the next leg higher.
Not every red candle is bearish.
Sometimes it's just a strong stock taking a breather.
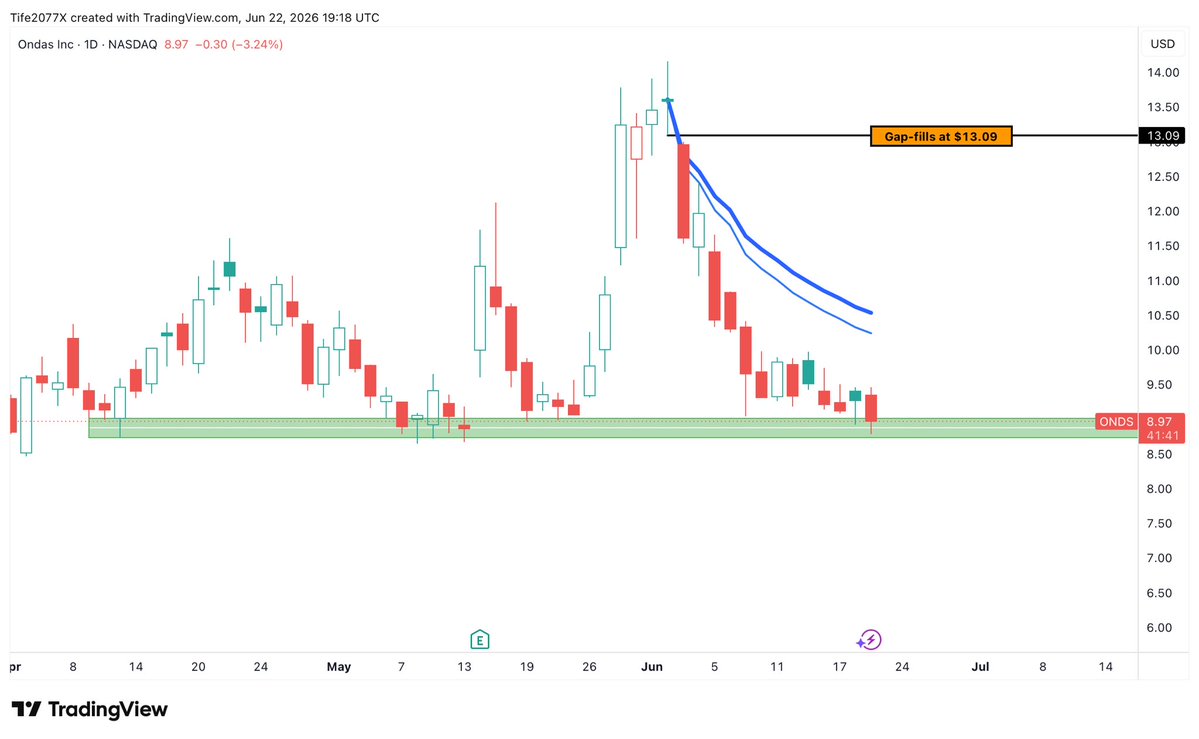
$ONDS Chart update
No major change to my view here.
Price is still sitting right on the support zone and, so far, bears haven't been able to break it.
After a move from $13 all the way back under $9, I'd normally expect more panic selling than what we're seeing now.
Instead, we're getting a slow grind sideways.
That doesn't mean the bottom is in, but it does tell me supply is starting to dry up.
As long as $8.65-$9.00 holds, I'm keeping this one on the watchlist for a recovery move.
Not a breakout yet. But definitely not one I'm ready to write off either.
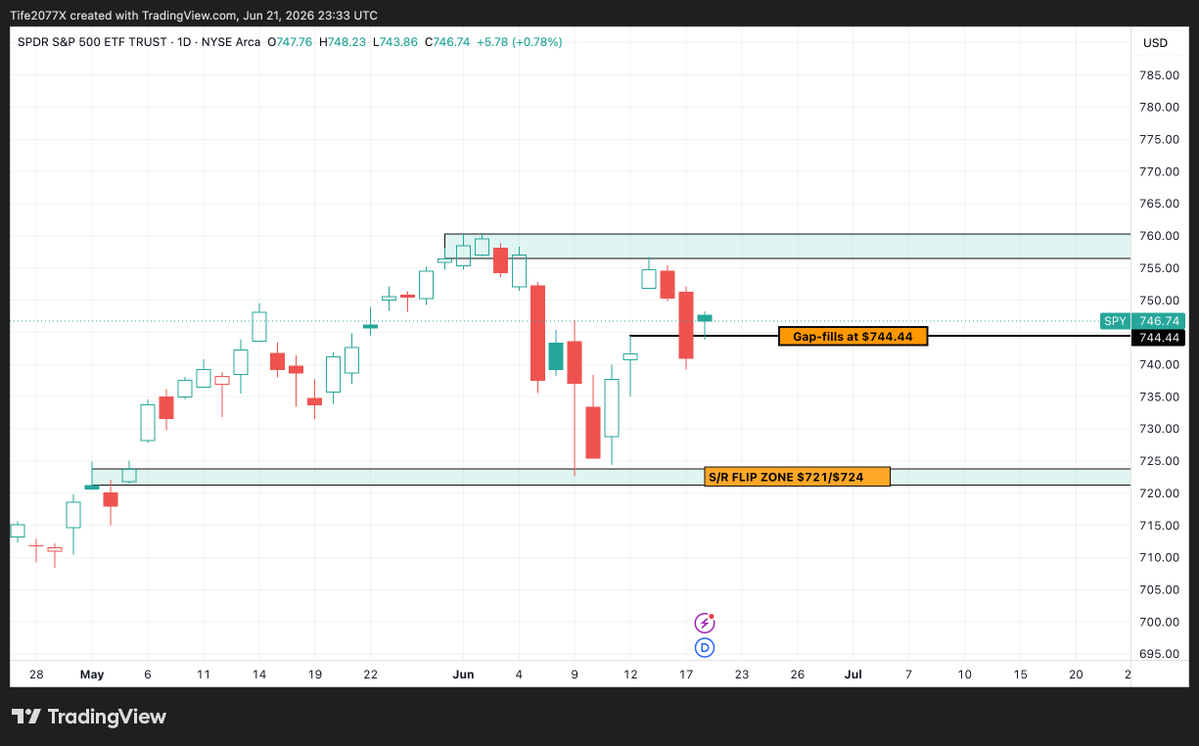
$SPY Update
The original breakout thesis has weakened.
SPY failed to reclaim the $757-$760 resistance zone and sellers defended the area aggressively. Price has now slipped back below the $744.44 gap-fill level, removing one of the key bullish signals from the original setup.
The focus now shifts to whether buyers can quickly reclaim $744. Otherwise, the probability of a move back into the $721-$724 S/R flip zone increases significantly.
The market hasn’t broken down yet, but this is no longer the clean breakout structure it was a few sessions ago.
$CIFR Research Update
Conviction remains elevated despite today’s red candle.
Price successfully broke above previous highs and is now testing the breakout area from above. This type of retest is common after impulsive moves and often determines whether a trend can continue.
Thesis remains unchanged while above $27.15
$SPY The plan is to enter a long position as SPY nears the resistance area around $757.10 to $760.40, aiming for a target at $783.77. A stop loss is set at $744.44, just below the recent gap fill, to manage risk effectively.
$QQQ has recently broken above a flag formation, indicating a likely continuation of its upward movement. With strengthening relative strength, you could wait for qqq to reclaim it previous highs and new target would be the fib extensions 1.618. or you could just get in here, considering the target is set at 768.73, while a stop loss is positioned at 724.01 to manage risk.
$ONDS appears to be setting up for a potential reversal as it shows oversold conditions and a divergence in RSI while testing an important support level. The initial target for this setup is near $10.68, with a risk of dropping to $8.65.
$NBIS has achieved a new all-time high and has successfully broken through previous resistance, which is now providing support. The strong relative strength and favorable chart pattern suggest a potential upward movement, with the target set at 318.02 and a stop loss at 272.1 to manage risk.
$MU is breaking into new all-time highs, confirming a bullish trend. The breakout targets the 1.618 Fibonacci extension at $1,234.48, with the entry at the recent high close. The stop is set below the S/R flip zone to manage risk.