Step 5: Entries & Exits
Finally, drop to 4H/1H.
Use Fibonacci, counter-trendlines, or candlestick confirmations.
This is where you time your sniper entries while staying aligned with the bigger picture
Step 4: Plot Minor Levels
Now zoom into Daily/4H.
Mark smaller zones (minor support/resistance).
This gives you precise spots to look for reversals, pullbacks, or continuations.
Step 3: Flow of the Market (Trend)
Zoom out.
Where’s the market heading? Bullish or bearish?
Trade WITH the higher timeframe flow, then look for entries on lower timeframes.
This is how swing traders catch 500+ pip moves.
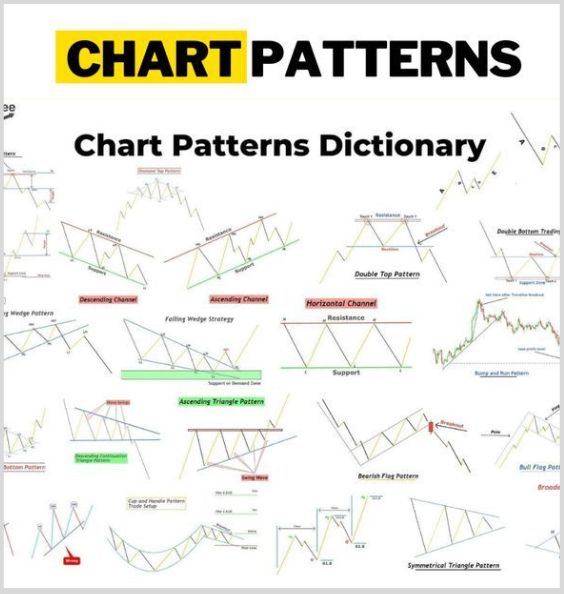
Step 2: Identify Patterns
Patterns repeat.
Head & Shoulders, Double Tops, Triangles.
You don’t need to master all 20+.
Just focus on a few high-probability setups.
Patterns = a trader’s map.
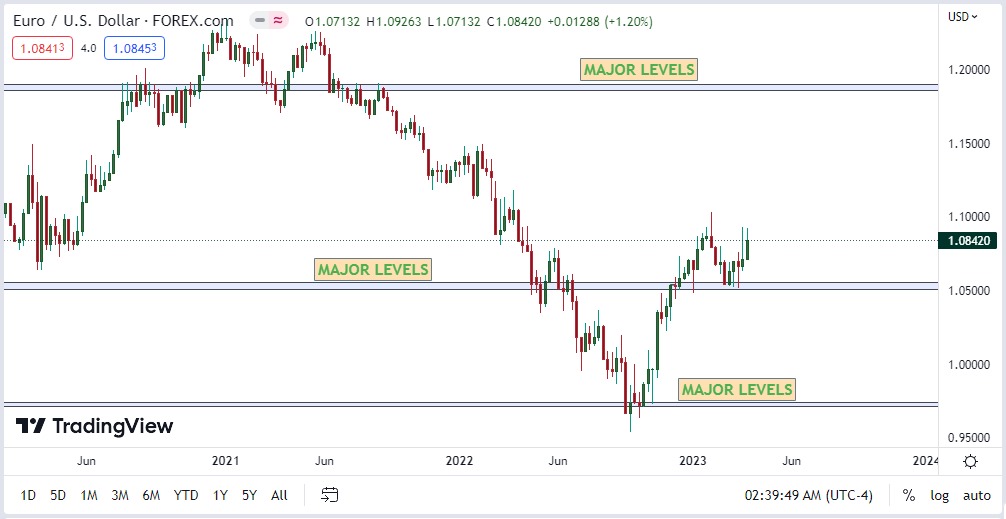
Step 1: Plot Major Levels
On monthly/weekly charts → mark support & resistance.
These levels are powerful because they took weeks/months to form.
The longer it takes to form, the stronger it plays out.
Why does this matter?
Because higher timeframes reveal the real trend.
Lower timeframes are full of “noise” and fake moves.
If the monthly trend is bullish but you’re selling on 15min charts… you’re fighting the market.
And the market always wins.
What is Top-Down Analysis?
It’s a method of analyzing the markets by starting from higher timeframes (monthly/weekly) and working down to lower timeframes (daily/4H/1H).
Think of it as “zooming out before zooming in.”