The same candlestick pattern can be a high-probability setup or pure noise — depending on where it forms.
Bullish harami in a trend ≠ bullish harami in chop. Doji at support ≠ doji in no-man's-land.
5 examples from the last week. Same patterns, specific contexts, real outcomes. 🧵
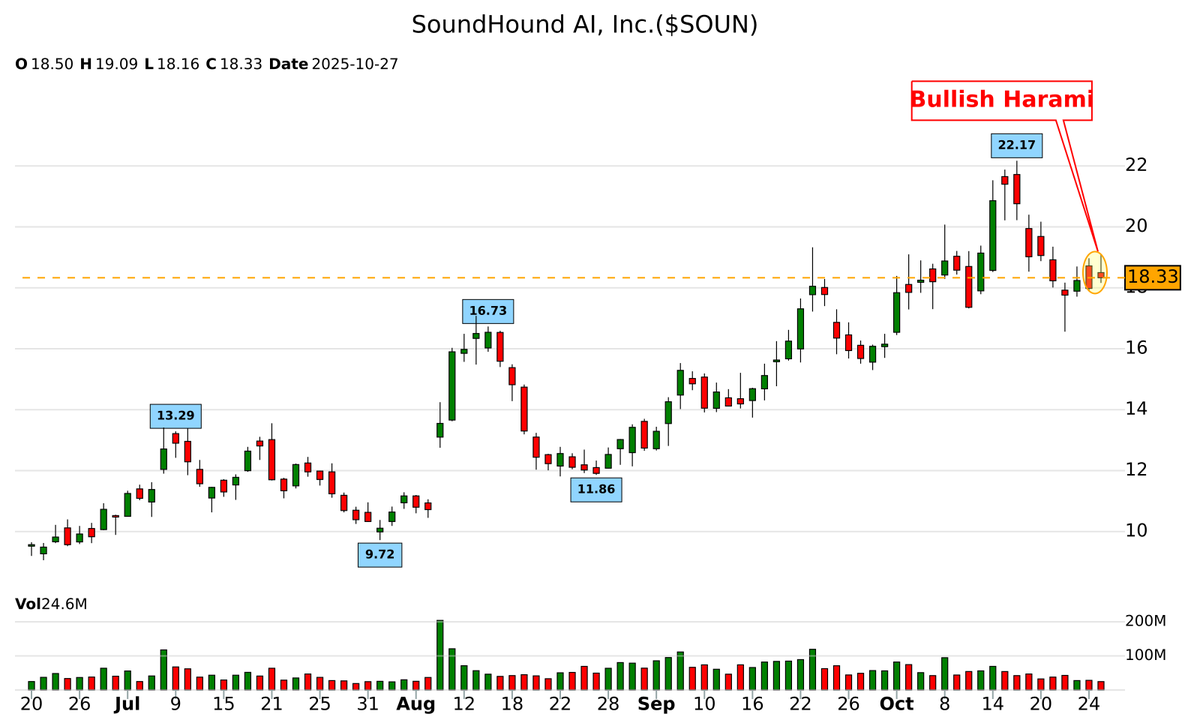
$TWLO bullish harami above the MAs = +28%
$STIM doji at horizontal support = +28%.
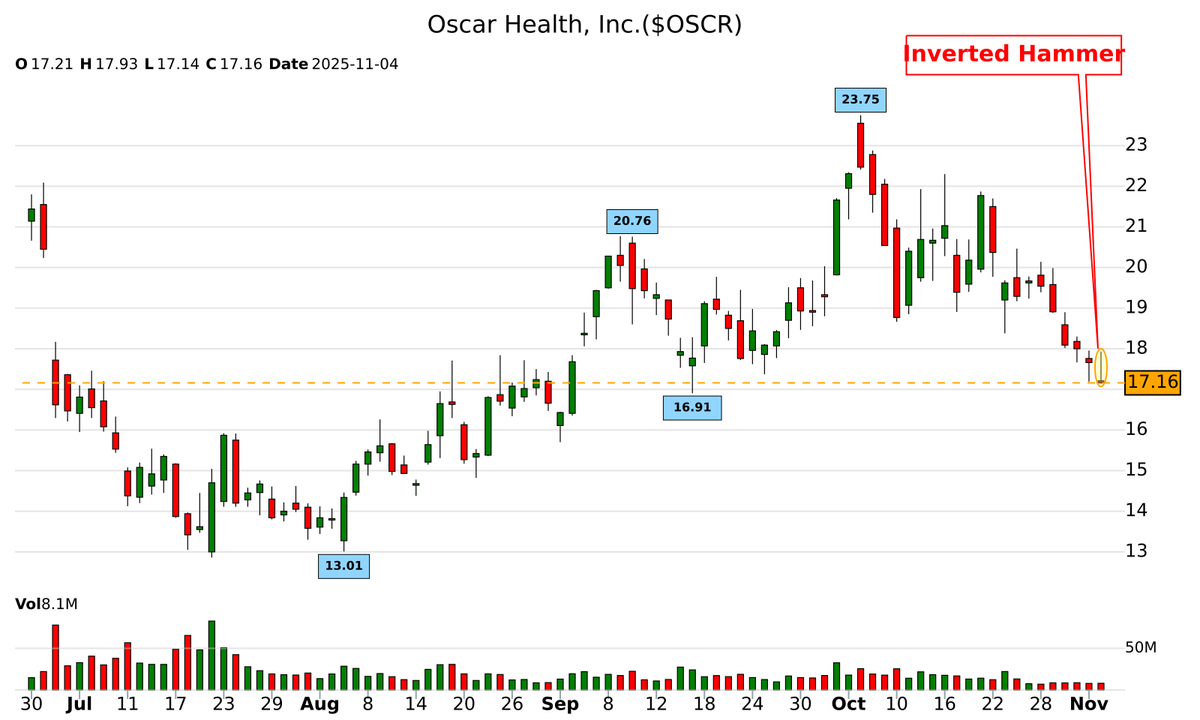
$PCOR inverted hammer at horizontal support = +8%
$ABNB — why the golden pocket matters.
The 61.8%% fibonacci retracement is called the golden pocket. Bullish Engulfing forming here means buyers are showing up at a key level.
Fib levels work because enough traders watch them. Self-fulfilling, but real.
$SRPT — why moving averages matter.
Price is testing a key moving average. Doji at this level tells you the market is deciding: bounce or break.
Moving averages act as support because enough traders use them as reference points.
$COIN formed an inverted hammer with RSI nearing oversold territory. Price remains under MA50 and EMA21, so the setup needs follow-through to confirm a reversal.
Is a downtrend losing steam? Watch for the Bullish Harami Pattern! This powerful reversal signal is our favorite for swing trades. 📉➡️📈. We identified high-success applications of this pattern where it generated as high as 27% returns for swing trade! See the charts below.
$PSA, $TECH, $NEE, $COIN, $ABNB