Our Tableau Public Virtual Viz Gallery has a new limited-time exhibit of interactive resumes! Check out our latest blog post to meet the authors and learn more.👇 https://t.co/J883LJyfbe
What did it take to get into #DS21 at @dataschooluk? Here are the vizzes of those that made it through and recently completed their training.
https://t.co/4dFT5GsMpO
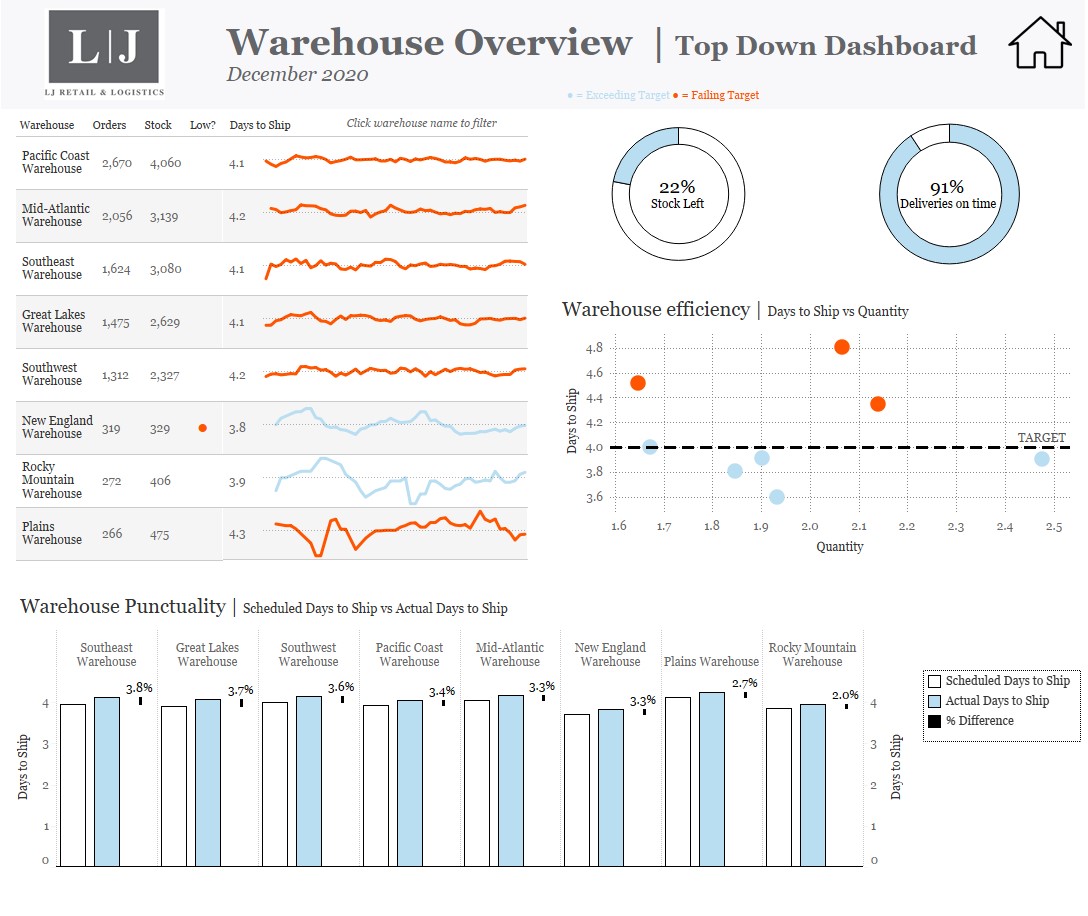
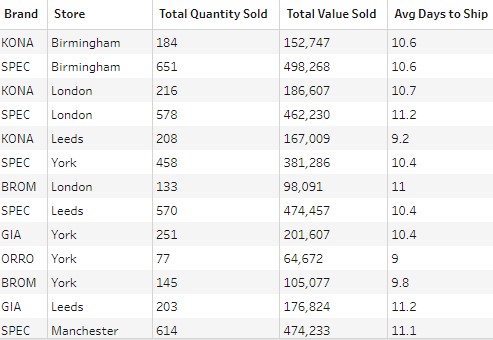
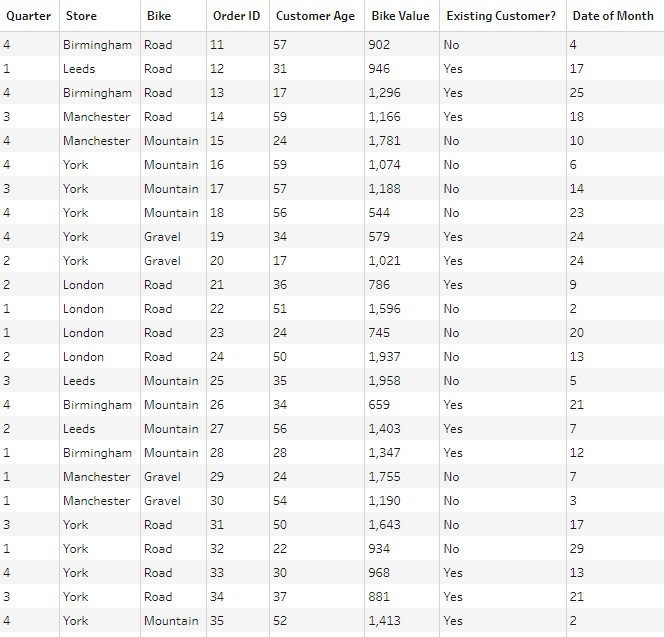
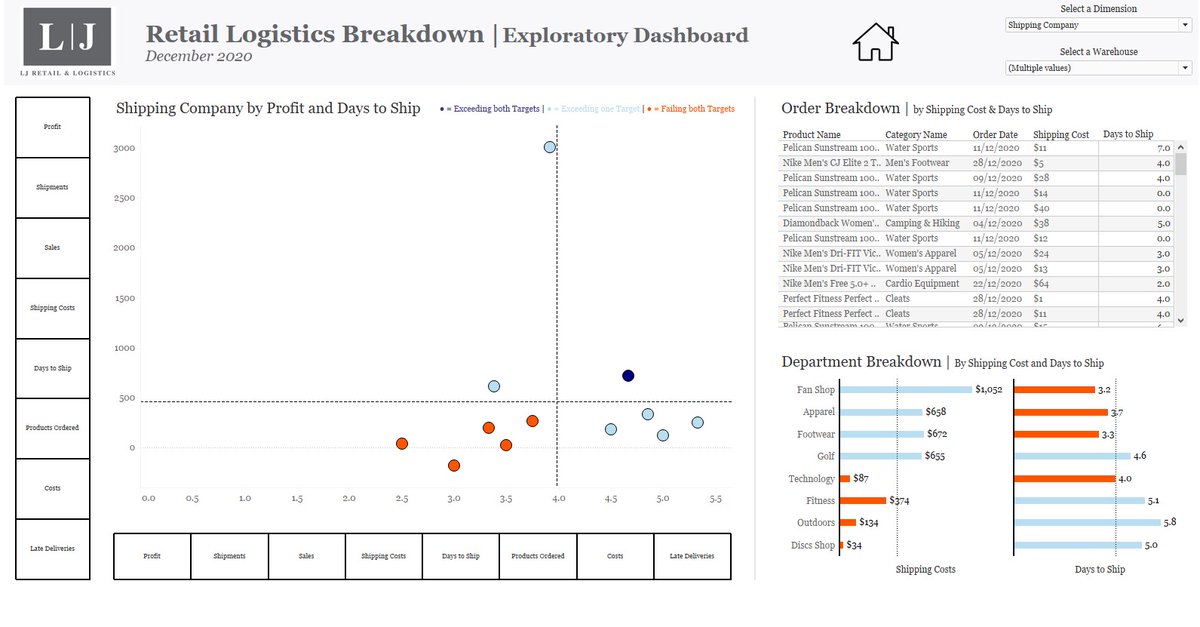
Hard to believe our training at the @dataschooluk has come to an end! It's been such an incredible last 6 months. Our final project was to create industry/departmental-specific dashboards so I had a crack at some retail/logistics dashboards.
The @infolabUK has a meetup group which shows you all the events we are running for FREE. We need 115 people to hit 5000 people on this group... please join https://t.co/YFPlYgaVcm
Oops forgot to tweet about @JoeKernydata and his session about Parameters for Learn what the @dataschooluk learns. But up next we have @LetsGetVizical talking about all things Dashboards and Interactivity
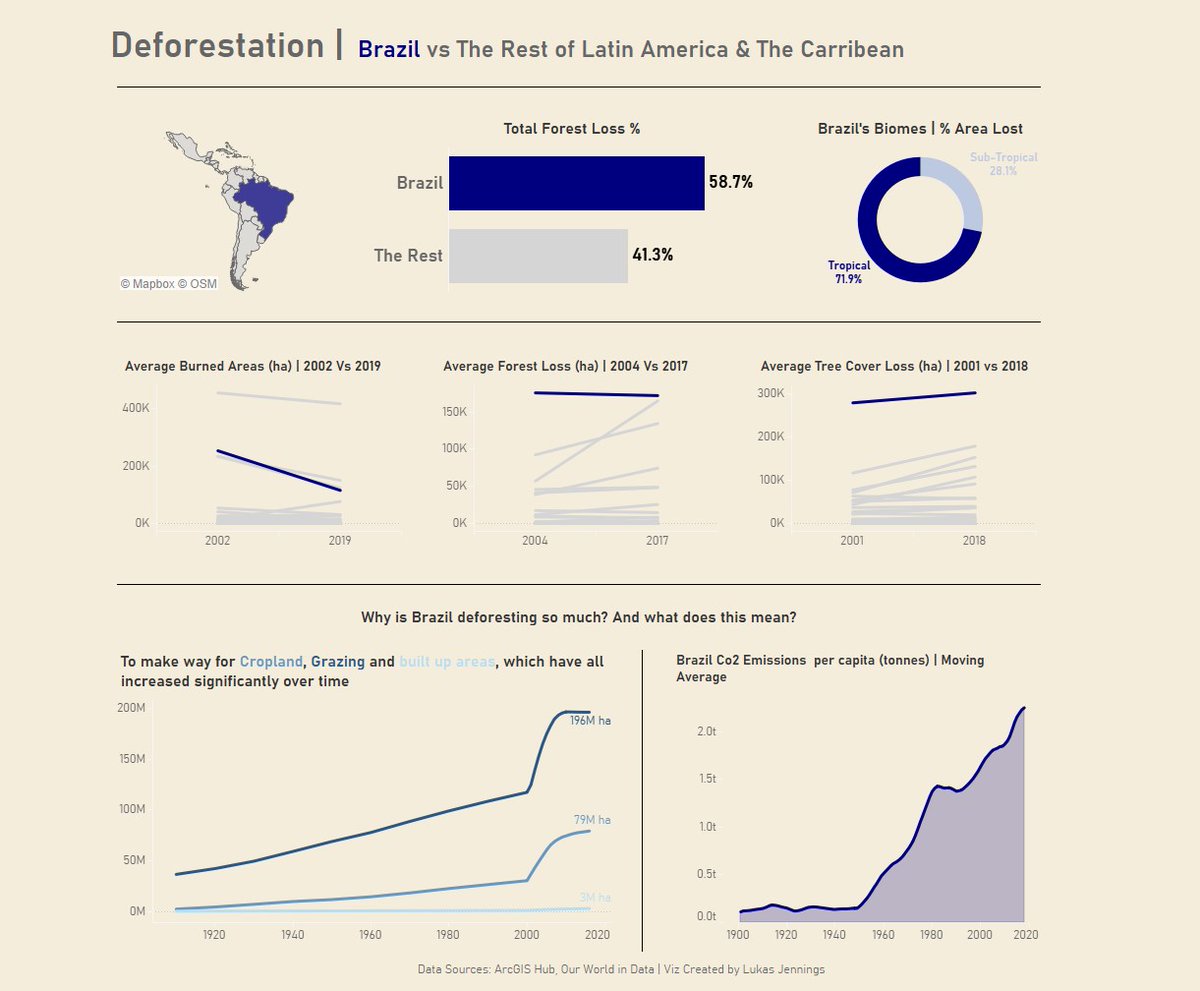
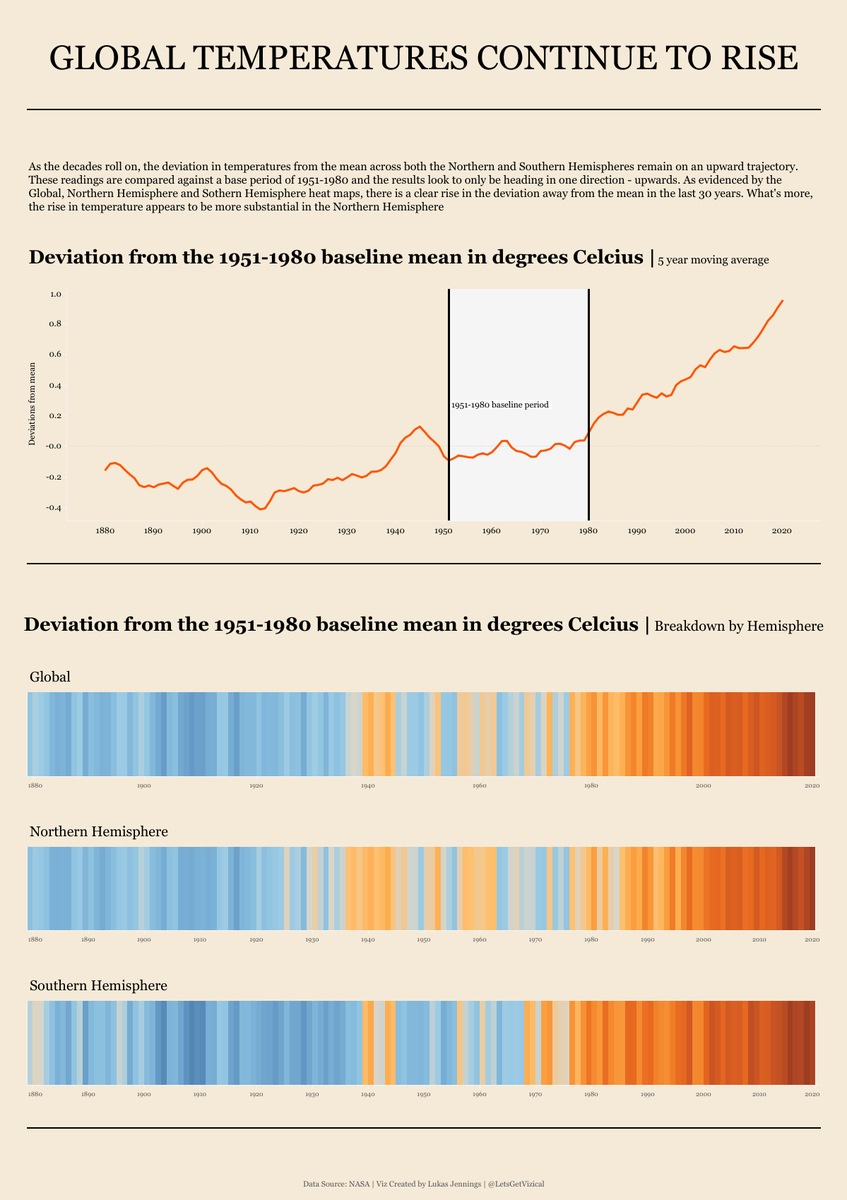
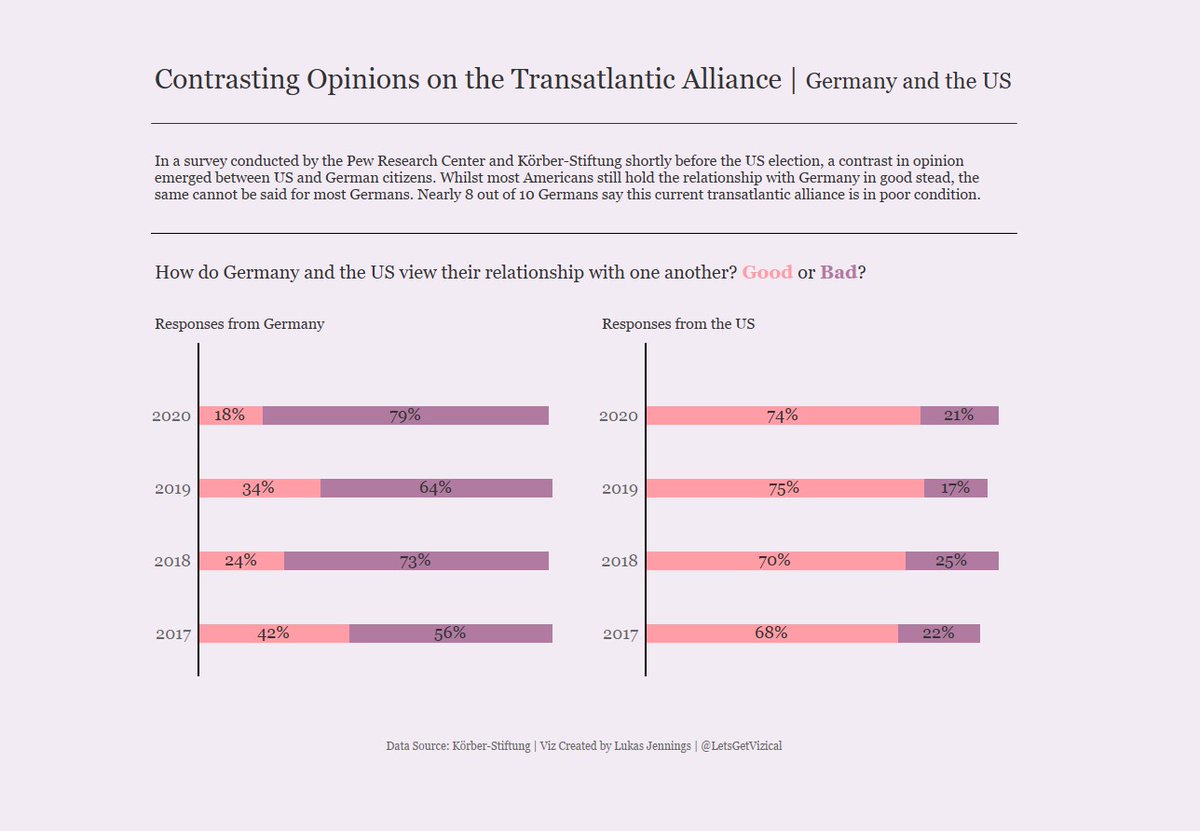
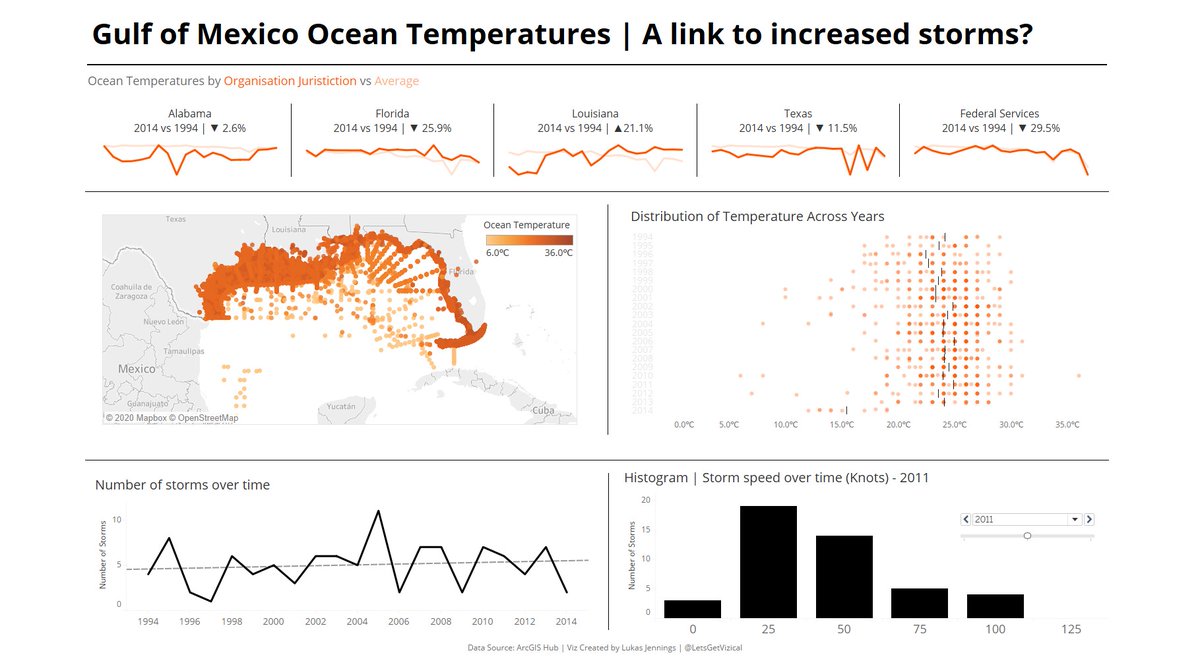
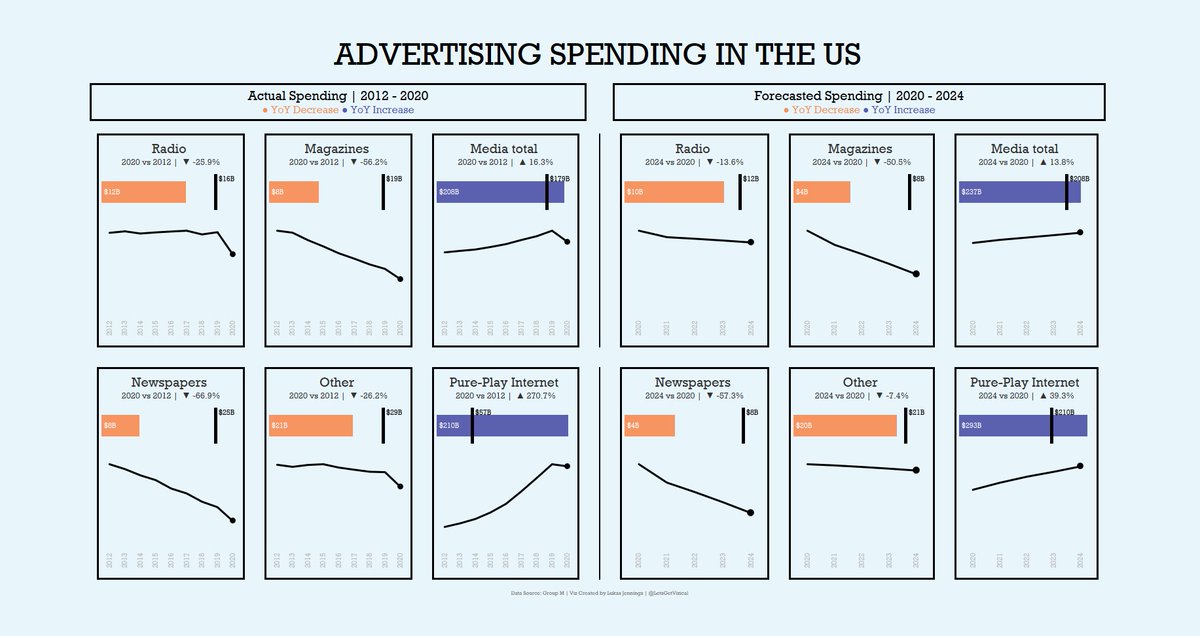
Thoroughly enjoyed Dashboard Week at the @dataschooluk - my favourite week of training so far! Big fan of the environmental data sets we were given every day as well. Here's some of the content I created this week:
The @dataschooluk in numbers. That's over 500 blog posts per year. If you're not following the blog, you're missing tons of tips to help you improve. I think we might be onto something with this Data School idea. https://t.co/f7BrwDpcQg
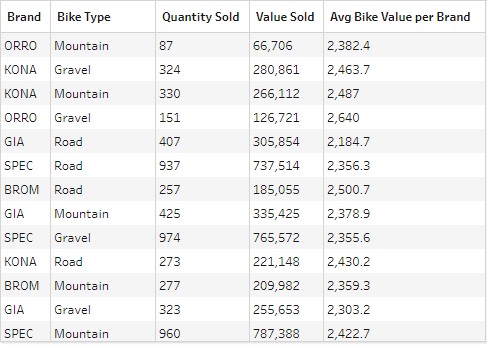
Tableau Tip of the Day: CASE Statement Maker Calc. Need to populate a long list into a CASE. Here's a Calc.
//CASE [Sub-Category]
str("WHEN '" + min([Sub-Category]) + "' THEN " + str(index()))
Drop calc on canvas, copy from data window and paste into new calc. #TableauTip