Lastly, the coefficient of determination (R²) indicates how well data fit the statistical model (our line). Values range from 0 to 1, where 1 means perfect fit. It's like the satisfaction score for our line!
<<7/N>>
Understanding linear regression isn't as hard as it seems! 📈🤓 It's all about finding the best-fitting line through your data points. Let's dive into the math behind it!
$linreg https://t.co/7ikyVXhIf7
<<1/N>>
The correlation coefficient (r) helps measure the strength & direction of a linear relationship between 2 variables. It ranges from -1 to 1. Closer to 1 or -1 = stronger correlation.
<<6/N>>
Linear regression is your go-to MVP for predictive modeling! 📈 Let's break it down together. Dive in with $linreg and elevate your stats game! https://t.co/7ikyVXhIf7
<<1/N>>
Linear regression shines in simplicity. Yet, it's handy for uncovering trends and forecasting. Just remember, it works best with linear relationships. Curvy trends? Not its thing! <<9/N>>
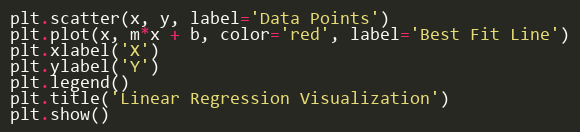
Voilà! You've visualized your linear regression like a boss. Keep experimenting with different datasets and witness the magic of ML unfold. 🌟
$linreg https://t.co/7ikyVXhIf7
<<6/N>>