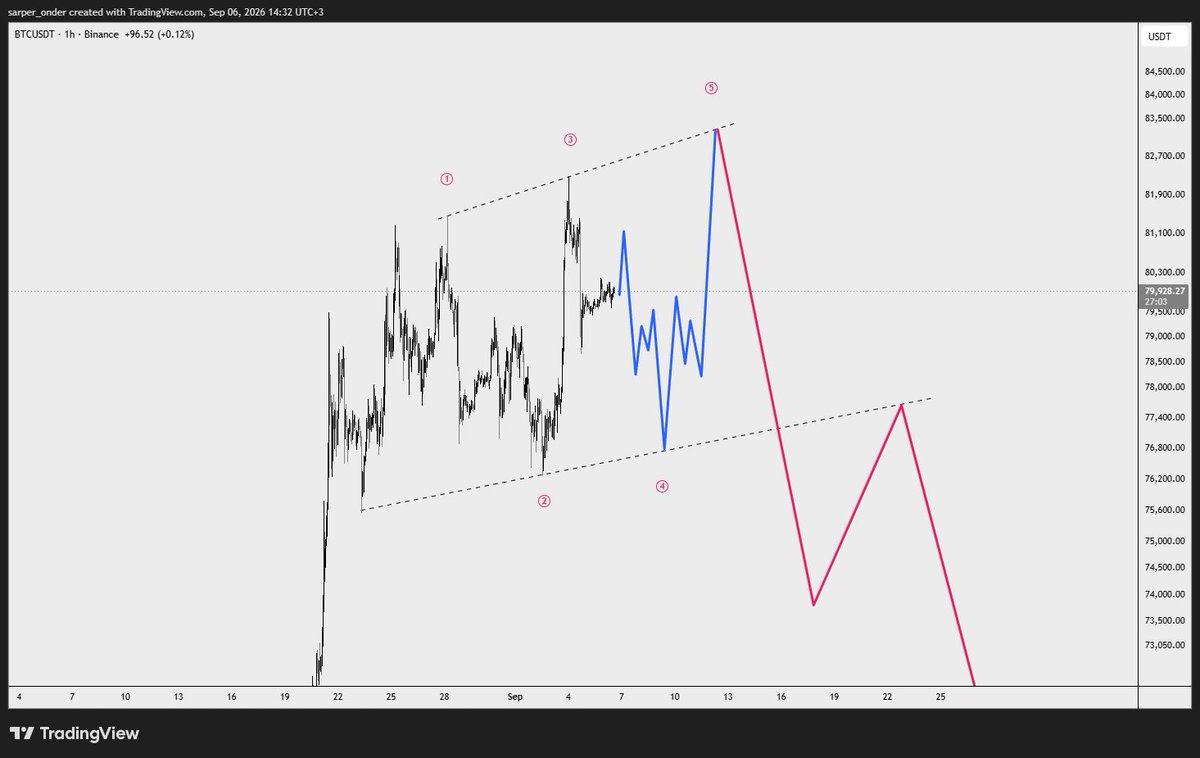
🚨 BITCOIN JUST CONFIRMED THE END OF THE BULL TRAP
I told you to long $BTC at $58K and short at $82K.
Everything is playing out exactly as I predicted.
$79K → $70K → $62K → $53K → Bull Run
Don’t become exit liquidity.
Save this chart and compare it later.
Reminder: I called the $16K Bitcoin bottom and the $126K top.
My next call will be the biggest one of this cycle.
Turn on notifications. Most people will follow me too late.
#BTC
Bitcoin has officially Monthly Closed beneath the Macro Downtrend for August
However, given that this Macro Trendline is a dynamic resistance, by virtue of the passing of time price has moved beyond the Downtrend
More, price has Monthly Closed above the April/May 2026 candle-bodied highs, which are now perfectly confluent with the Macro Downtrend
Bitcoin now has a chance to post-breakout retest both the Macro Downtrend and these April/May Monthly highs in an effort to turn them into new support
bitcoin:native #Bitcoin
bitcoin:native August Monthly Candle just closed and we have a level around the $72k to $71k area which is the middle of the previous monthly candle pump.
In ideal scenario the retracement should happen but in my experience, if Bitcoin is really bullish it leaves no traces back and instead leaves everyone sidelined without proper pullbacks.
if so our next target could be the yearly opening level around the $87k area.
#bitcoin #btcusdt #btc
bitcoin:native
Today, the monthly candle will close.
If #BTC closes above $76K, it’s very bullish. But we could still see a dump below this level before the day ends.
My plan for #BTC:
1. We got an impulsive move up from the $62K/$64K support zone (DONE)
2. We hit all the Fibonacci targets (DONE)
3. We stopped at Strong Resistance — $83K (DONE)
4. The key zone is $83K/$85K
5. Scenario one — we get a pullback now, followed by a move up toward the key zone (LOAD)
6. Long zone 1: $74K/$72K
7. Long zone 2: $72K/$69K
If we follow the 2023 price action, we had 5 daily candles of consolidation with a liquidity sweep below, followed by a move higher. That’s why I’m sticking to the plan and waiting for lower levels to enter longs.
Historically, we have always corrected from the weekly 50-week moving average, and that’s exactly where we stopped this time.
$SUI — my long was stopped out at breakeven.
$ETH — still holding the long.
Coins I’m watching: $ETH, $SOL, $HYPE, $LIT, $PUMP, $MNT, $CAKE, $ZRO
REMINDER: I warned about the BTC bull trap at $82K, the bounce from $62K, the summer drop, and the SPACE X decline before they even happened.
FOLLOW ME AND TURN ON NOTIFICATIONS. MOST PEOPLE WILL FOLLOW ME TOO LATE.
$BTC just hit a 50/100 EMA crossover on the weekly.
These crosses have led to some pretty big moves in the past, both up and down.
So this is definitely a zone worth watching. Could be the start of a pump, or we could see another dump before the next move.
There's an interesting historical pattern forming on $BTC monthly chart.
Every major cycle bottom 2015, 2019, 2023, happened as MFI dropped into this same oversold zone, following a similar downtrend structure.
Now, the structure looks like it has broken out, but MFI is still sitting above that key zone.
Is this the major trap, or is Bitcoin finally going to break the pattern and play out differently this time?
Fun fact: People with a foot fetish tend to have higher IQs, regardless of gender. But fewer women are into feet—probably because China’s national football team sucks.:)