New in LivingCharts 🚀
We’ve added 2 new chart types:
📈 Stacked Line Chart Race
📋 Table Chart Race
Plus a new dynamic counter element:
Total / Average / Median
Now you can create even more animated data stories with https://t.co/OtwOmfhNzG
✨ Italic text is now available for all fonts!
You can now use italic styling with any font in LivingCharts — giving you more flexibility when designing titles, labels, timeline events, and text elements.
A small update, but a useful one for making your charts look more polished 📊
Try it now 👉 https://t.co/CpGzl364iU
🚀 New feature for better storytelling
Now you can control how text and images appear — and disappear — in your videos.
Add titles, highlights, and key moments exactly when you need them to guide the viewer’s attention.
Perfect for YouTube videos, data storytelling, and presentations.
Make your charts not just informative — but engaging 🎬
🚀 Update: Labels above values
You can now position labels above values in your charts.
This makes layouts more flexible and improves readability — especially in dense visualizations.
Try it in your projects! https://t.co/6rGnJc7h66
🌙 Dark mode is here!
LivingCharts now supports a dark theme for a more comfortable experience.
Less eye strain, more focus on your data 📊
https://t.co/6rGnJc7h66
@jaz1slost Hi Jaz, thanks a lot for the idea - really appreciate it! 🙌
We’ll keep this feature in mind. Not sure we’ll be able to add it anytime soon since we’re focused on other things right now, but it’s definitely noted.
🚀 New updates in LivingCharts!
• Timeline Events — add important moments directly to your charts
• Dynamic Values — numbers that change over time, perfect for total counters
• New date & number formats with localization support
• Many bug fixes and overall stability improvements
Update your projects and try the new features today 📊✨ https://t.co/CpGzl364iU
🚀 New in LivingCharts:
"Enable multithreading" is now available in the export dialog!
This experimental feature can speed up video export by up to 50%.
Might not work on all devices — but give it a try → https://t.co/OtwOmfhNzG
@NguyenGian29319 Unfortunately, we do not know the reason, since the transactions are handled by a third-party payment operator. We're sorry for that. Please write to us via email, and we will determine the best course of action in this situation.
A new feature for Bar Chart Race was added by popular request! 🎉
The "Show zero values" option lets you choose whether to display bars with a value of zero. Turn it off to hide inactive bars and keep your animation clean and focused.
Today, we’re excited to introduce Line Chart Race. Currently in beta, this feature is available for users who want to experiment with new ways of storytelling through data.
More information: https://t.co/TC238fvL0y
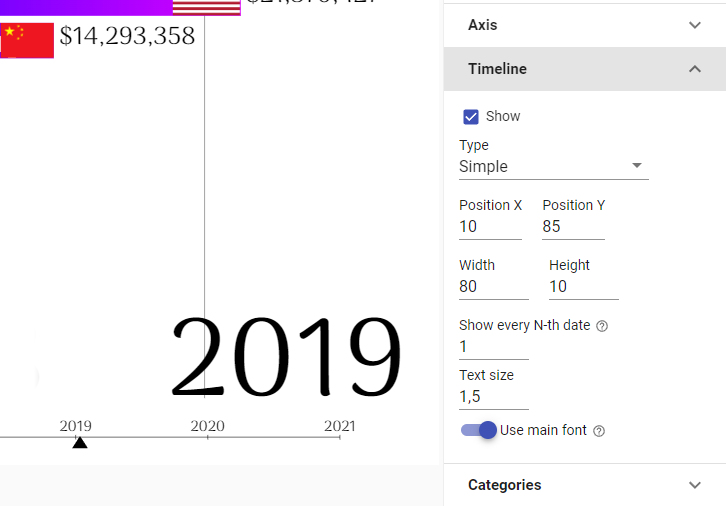
We’ve replaced the additional element "Timeline with moving dates" with a Timeline Settings Panel – now you can easily customize your timeline’s appearance! 🎉 Plus, we've introduced a new timeline style. Check it out on https://t.co/OtwOmfhNzG!
The Most Smoking Countries in the World 2000-2025
⚡Made with LivingCharts - clone this project and create an amazing visualization in just minutes!
https://t.co/UunFNtfstb
Countries by Alcohol Consumption per Capita 2000-2019🍾🥂
⚡Made with LivingCharts - copy this project and create an amazing visualization in just minutes!
https://t.co/VU7ZqI25P4