#BTC
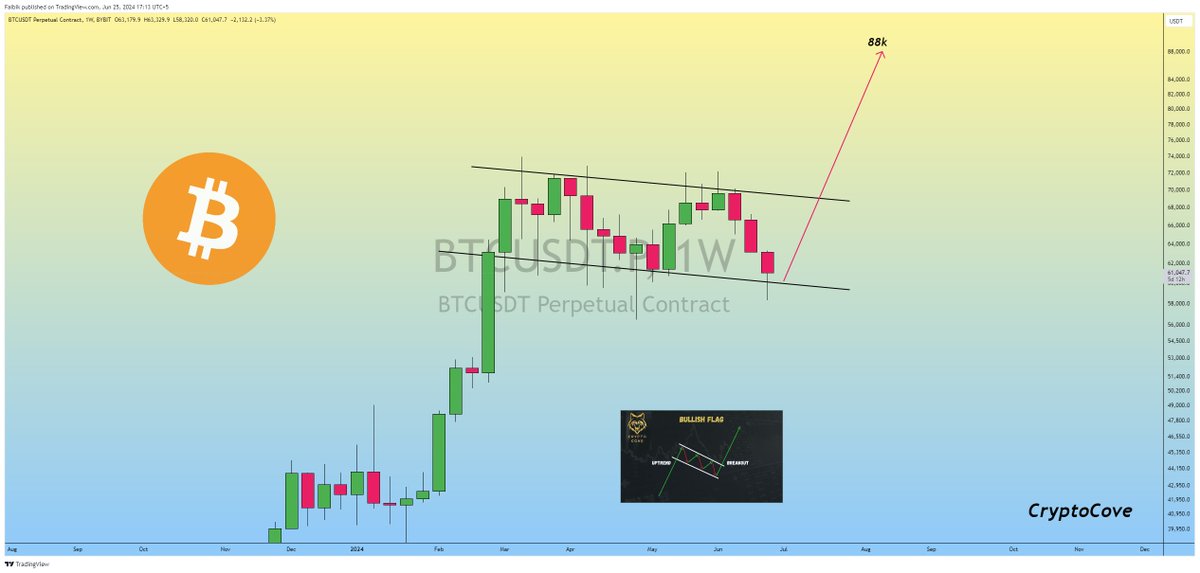
Positive initial reaction from the base of the pattern, which is also confluent support with the old All Time High area
Downside wicks below the pattern bottom (orange) are fine as long as price ultimately Weekly Closes inside the structure
$BTC #Crypto#Bitcoin
$BTC
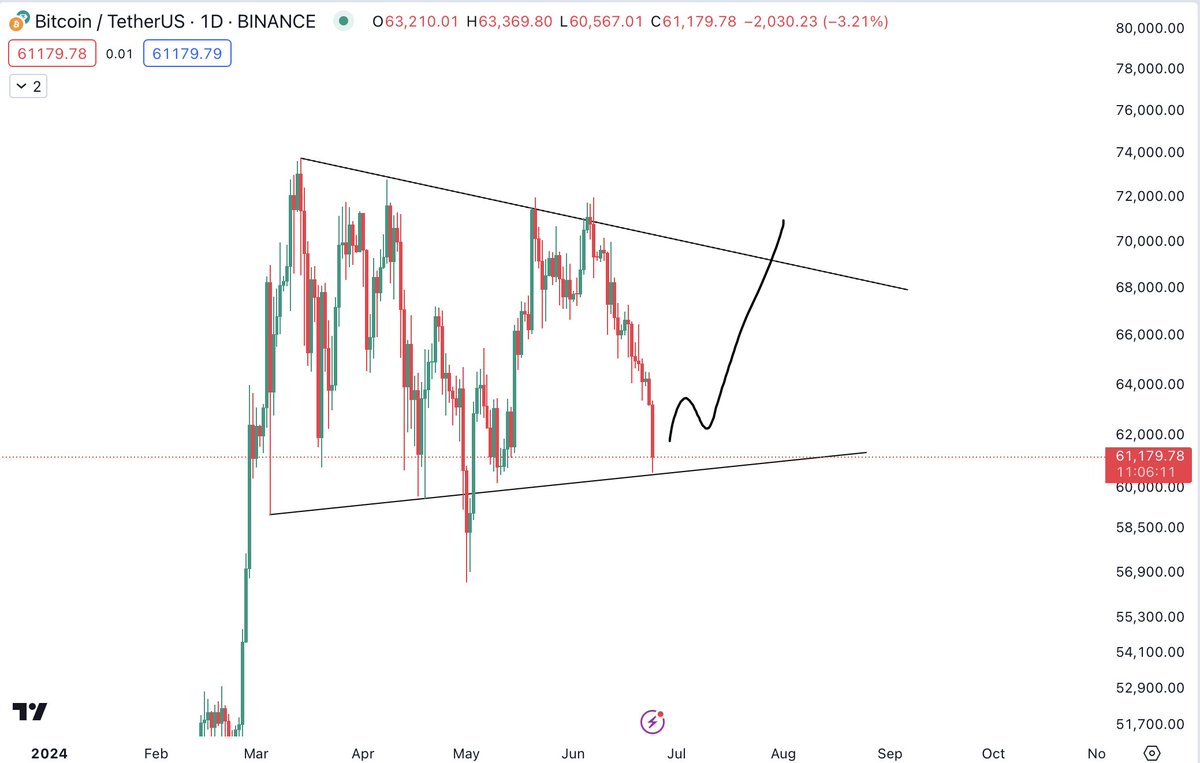
It really may have been this simple on #Bitcoin
Annoying this was, I had a short at $71k but closed it due to an expected double top.
Bullish or Bearish, supports are not for selling.
Gm ☕️
Yesterday, the market endured the selling equivalent of the estimated net selling that would come out of the entirety of the Mt. Gox #Bitcoin distributions.
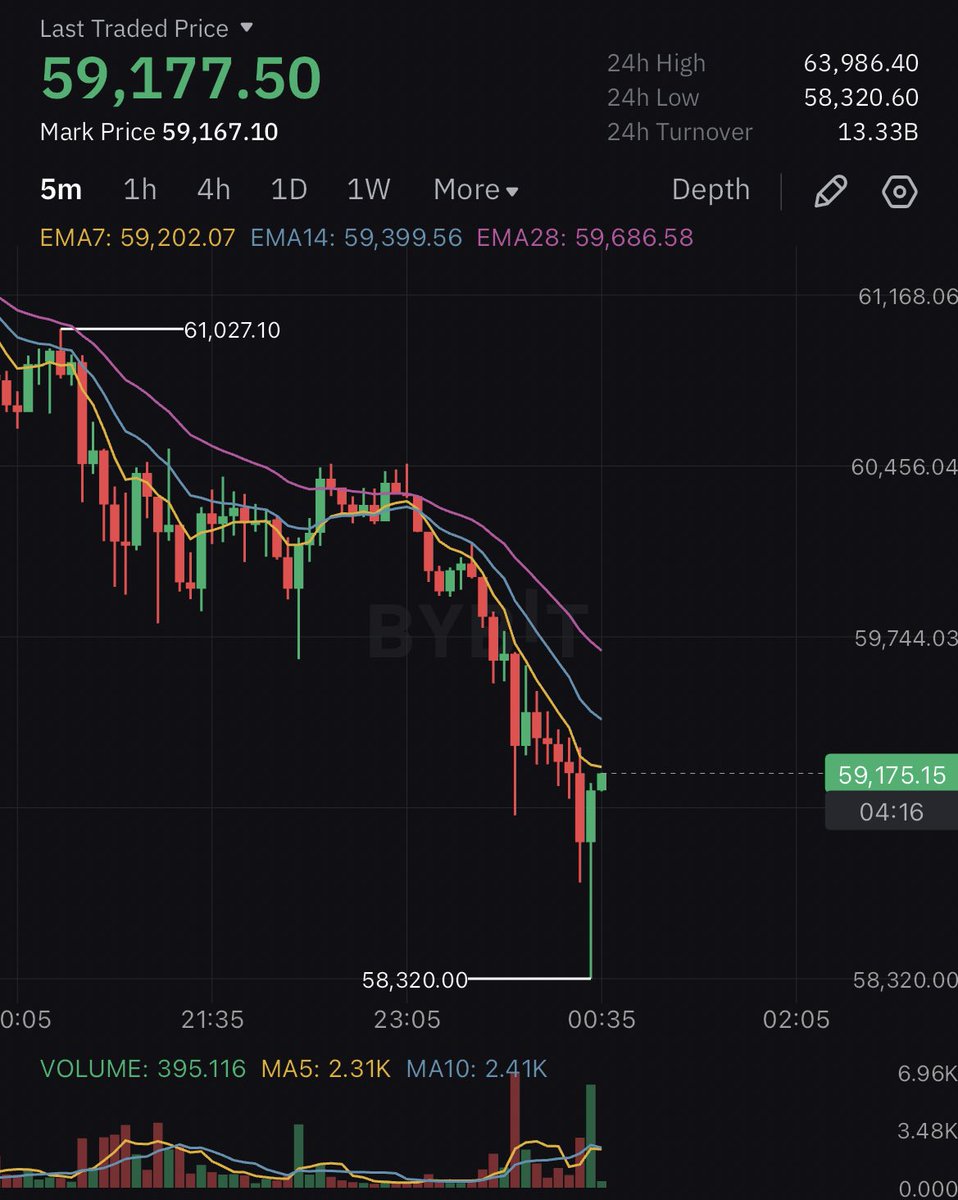
$BTC is still ranging.
The German government is selling #Bitcoin again!
Today, they transferred 400 $BTC ($24 million) to Coinbase and Kraken, and another 500 $BTC to an unknown wallet.
#Bitcoin
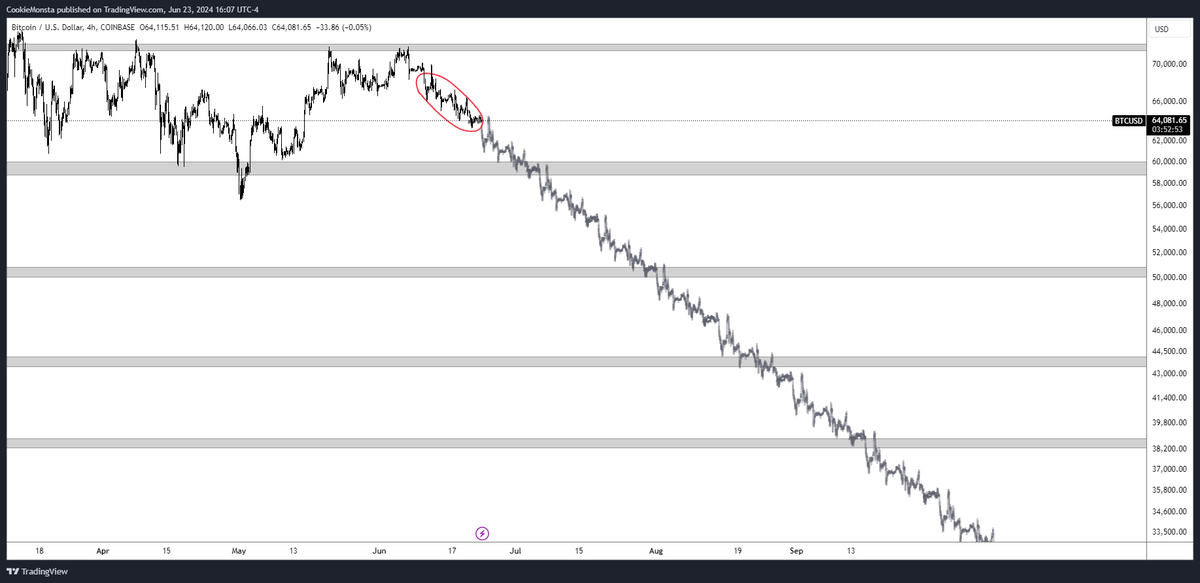
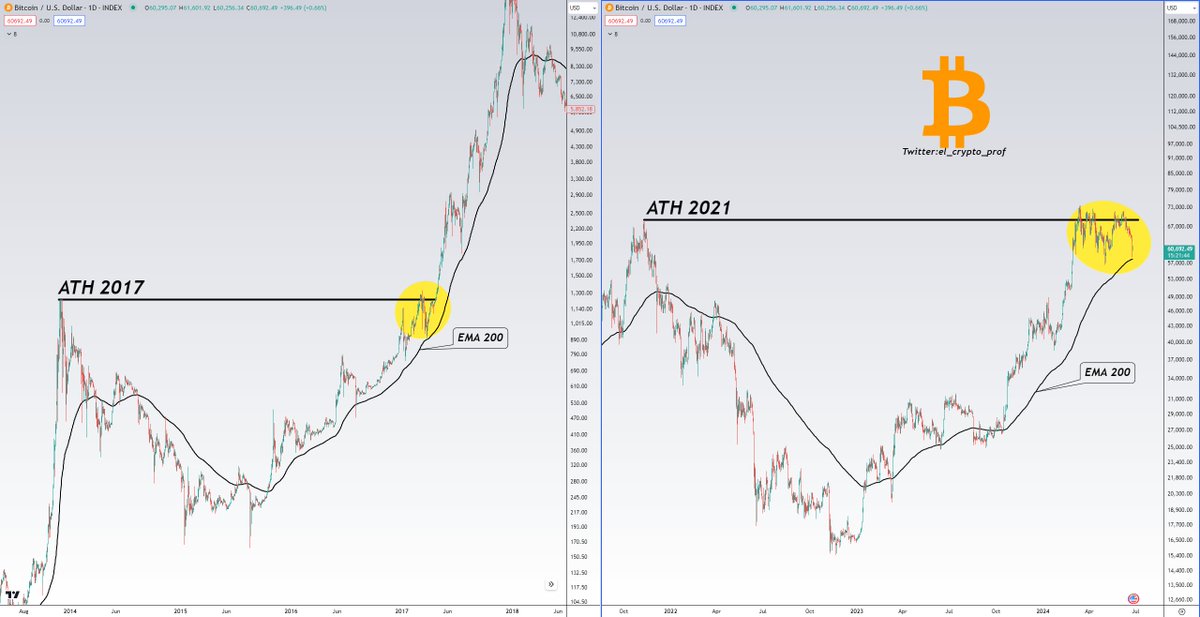
Whether 2017 or 2021, both outcomes would be great for the crypto market, but when I look at the steepness of $BTC, it looks very similar to 2017.
-Close to the 1D EMA 200
-Consolidation around the previous ATH
If you take a closer look, things don't look so bad.
Maybe the market is beginning to realize that the set up for $ETH is better than $BTC?
- Mt Gox has no $ETH
- The Germans aren't selling $ETH
- Ethereum doesn't have constant miner sell pressure to pay for expenses
- ETF ALSO coming to $ETH
- Supply shock bigger on ETH vs BTC
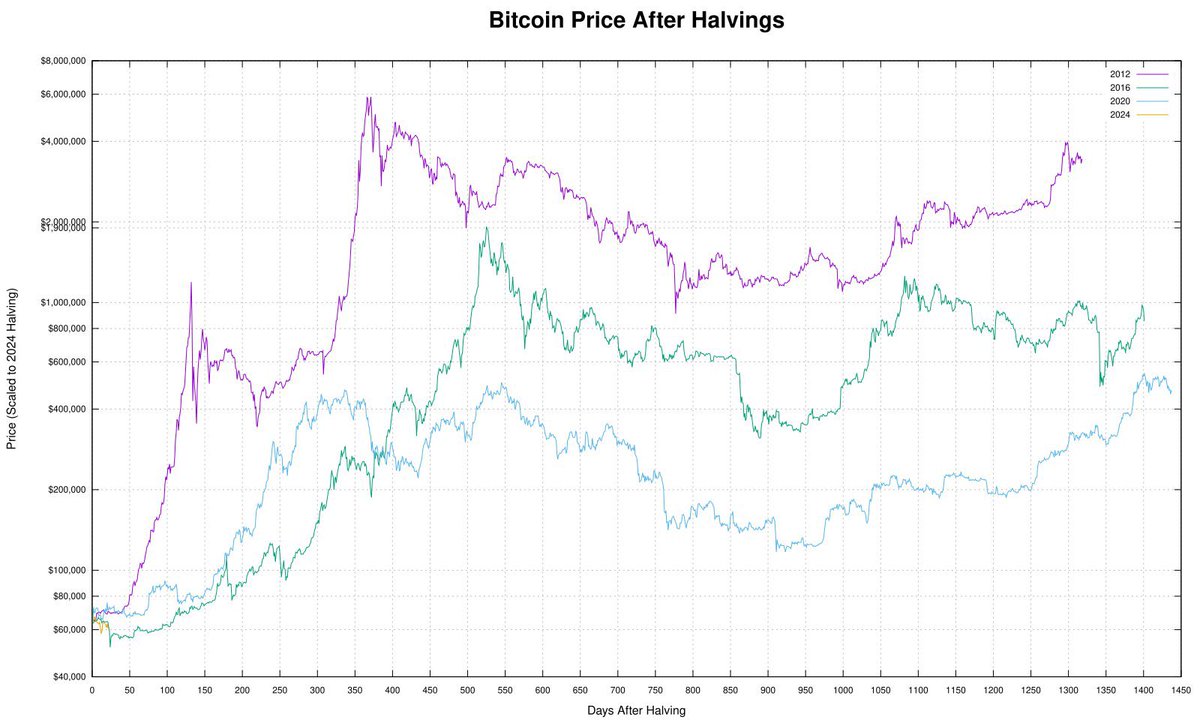
After the #Bitcoin halving in 2020 $BTC ranged 150 days in a boring price range between $9,000-$11,000
We are currently 60 days after the halving and people are deeply depressed about the price action
Meanwhile if we scale previous cycles we’re still on track to have a 2016-2017 run
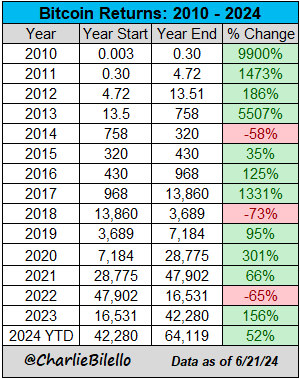
2012 scaled: $105,703.96
2016 scaled: $59,436.31
2020 scaled: $67,777.19
$BTC - It appears to be at July 2017 level. If the next local top is between 91k to 96k then it will retest 72k area during next drop. If the next local top is between 101k to 111k then it will visit 84k area during next drop. Top maybe around 176k and comes in November 2024.