Copper $HG_F had a large reversal after $5.95 -- 1.50 expansion of 2024 range (3.65-5.20). This zone was met with seller absorption, a breakdown at 1.414 led to swift sweep liquidity. The move was expedited by U.S. tariffs being reversed. Look for bounce 4.35.4.40 towards 4.78.
Copper $HG_F had a large reversal after $5.95 -- 1.50 expansion of 2024 range (3.65-5.20). This zone was met with seller absorption, a breakdown at 1.414 led to swift sweep liquidity. The move was expedited by U.S. tariffs being reversed. Look for bounce 4.35.4.40 towards 4.78.
ES Futures Daily Key Levels
If price sustains above 6060-6065 support level, expect a move towards 6080-6086 back to 0.618 PD RTH, with potential follow-through toward 6103 if momentum continues. High call gamma resistance at 6075, aligning with prior highs and liquidity from Monday.
Failure to hold 6060 could lead to a test of 6051 (0,618 Prior Weekly) and possibly lower. 6045-6035 (midpoint 0.50-.618 Prior Weekly and midpoint of the gap down from Sunday.
Later this week, a breakdown below 6029 increases the probability of further downside toward sub 6010 later this week, but we may only see that under a very high volume trigger (news catalyst or CPI data on Wednesday).
Key triggers today:
- Fed Chair Powell Testimony
- U.S. President Trump expected to announce tariffs to other countries
- Earnings: SMCI, SHOP, HUM, AN, MAR, ZG, LYFT, DASH, CFLT
ES Daily Levels Plan
Hope you guys had a great weekend. Quick of Friday’s and last week’s plan: once the weekly harmonic completed, a strong technical reversal triggered at ES 6123. This level was 0.882 Prior Weekly, a major liquidity trigger, and breakdown/breakout which prepared for potential reversal and liquidity sweep below. This brought us all the way down to 6041 (0.50 Prior Weekly fib) to close Friday with dealers needing to hedge the downside further as negative gamma exposure was very high. We were able to catch 20 pts towards 6118, and short from 6123 netted us 70 pts on this downward move. Hopefully you were able to follow my plan.
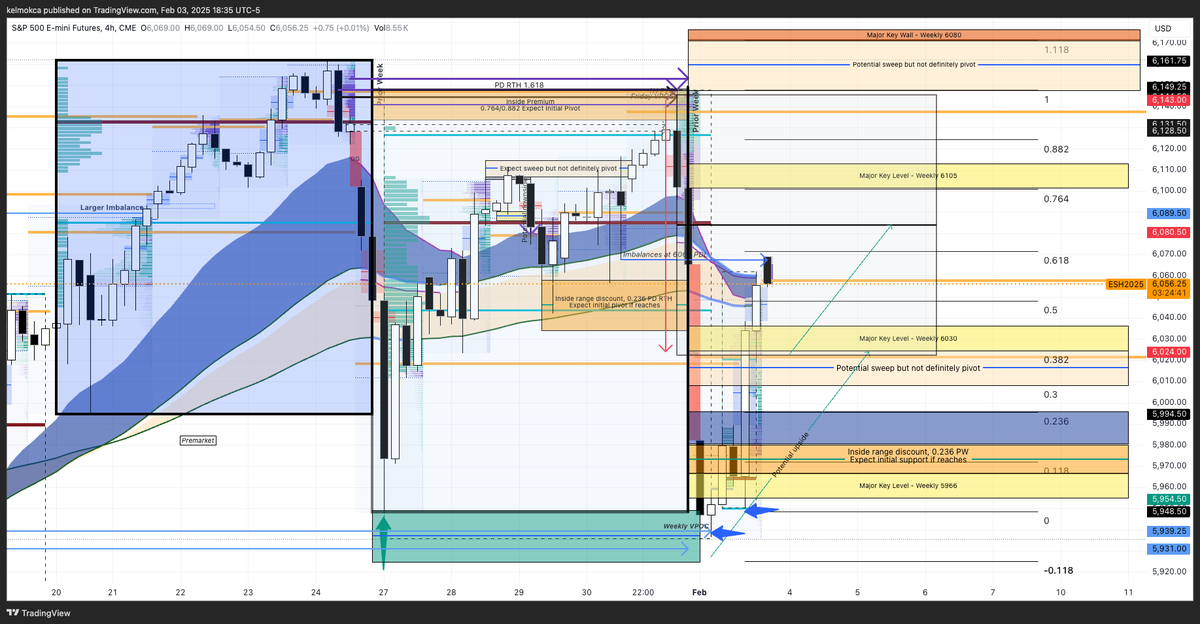
For this week, we start with another large weekend gap to bring price down to 6016 0.382 Prior Weekly technical retracement, and the market absorbed and bought this golden fib retracement level. We could expect a reversal to potentially recover the range back to the Prior Week’s VPOC level 6086 which is also about 0.618 Friday’s RTH. Potential upside move in progress with a technical move to reclaim ES 6055-6080, but there remains a deeper downside for liquidity to be swept if the aggressors push it back down.
📷 Key Levels Moving Forward
The next decision zone is 6055-6080, where we either confirm further upside back to 0.618 PD RTH, or breakdown toward lower supports -1.414/-1.618 PD RTH.
Bullish Outlook
If price sustains above 6055, a move toward 6080-6103 remains likely later in the week.
If price sustains above 6073, a move toward 6075 and 6082 through overnight and into Globex.
If recovers 6092, possibly expect 6104-6113 to be swept, but only after the opening hour of NY RTH Monday. A breakout above 6113 is very significant and may signal a new all-time high this week.
Bearish Outlook
If there is a strong rejection at 6098 and reversal, expect a possibility of 5995 to be swept if the market becomes bearish again.
If the market loses 6030 again, expect downside continuation toward 6019 -0.272 PD RTH.
Market Dynamics
Gamma exposure is very high at ES 6050 (-900M SPX) so it’s likely to be an important level at the market open on Monday — sticky until this changes.
Net Delta Exposure shows significant negative exposure between 6025-6050, indicating dealer hedging pressures that could amplify bounces (absorption initially) or declines if breaks below. There are some major nodes at 5980-85 and 5974-76.
Tech Sector Rotation this Quarter
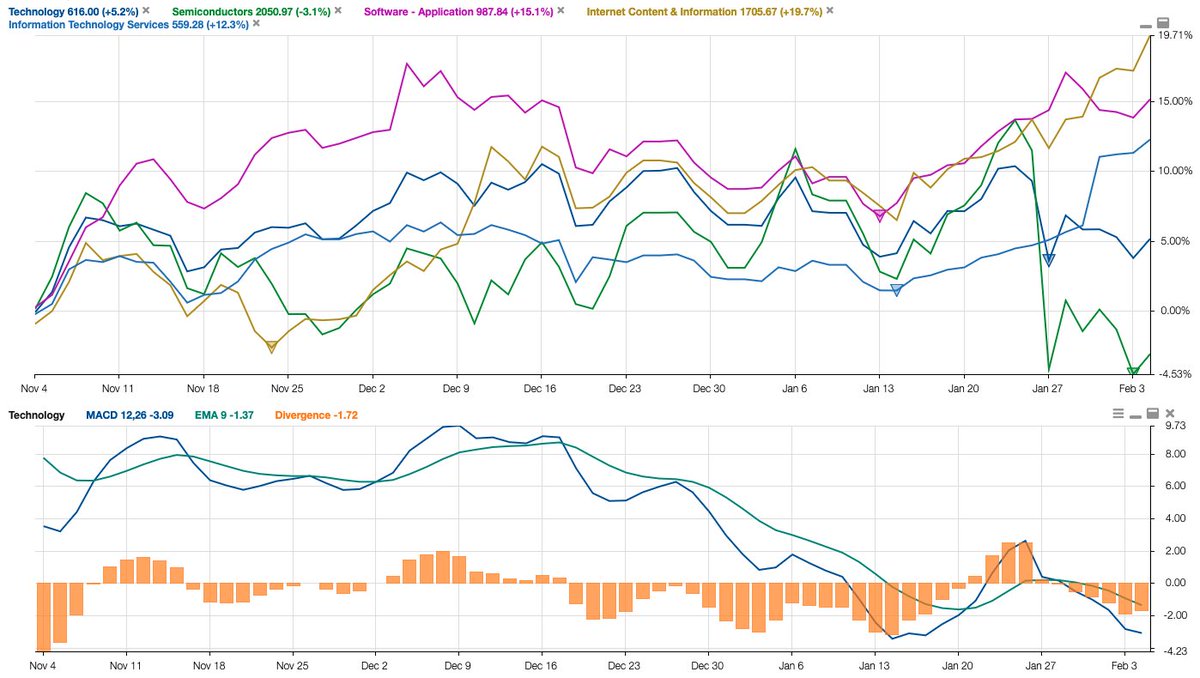
🚀 Internet Content (+19.7%) & Software (+15.1%) leading, while semiconductors (-3.1%) lag. Tech overall +5.2%, but MACD weakening—momentum shift incoming
🔍 Key Trends:
Software & Internet Content stocks still breaking out 📈
Semis cycling down since Fall, retracing back quickly📉
MACD suggests tech could consolidate before next leg, while there's still upside for software
📊 High-Momentum Stocks – Levels to Snipe ->
Reversals or Breakout Continuation:
$CRWD (451.75) $SNOW (198.15) $PLTR (111.90) $SPOT (637.55) $ZG (96.95) $DASH (206.33) $DDOG (183.5) $OKTA (106.5), $GTLB (74.10)
$ES $SPX is pushing into ES 6122 SPX 6100 (0.882 Fib Prior Week Range) -- this nears the completion of high timeframe harmonic pattern (likely Bat/Gartley). Get ready for a big ol' reversal or a massive breakout into 6165-6210 ES (~6140-6185 SPX)
Why This Level Matters:
🔹 0.882 Fib retracement – Deep retrace where reversals often happen
🔹 6100 SPX (ES 6122-28) call IV steepening – Market pricing in upside volatility
🔹 Volume rising and increased liquidity = big players
🔹 Structural confluence from last Friday's morning lows – This is where liquidity shifts happen
How This Sets Up the Next Move:
📍 Rejection at 6122-28 ES (~6100 SPX) → Expect a fade back to 6080-6060 ES (~6055-6035 SPX) -- Possible double or triple tap
📍 Break & hold above 6122 ES (~6100 SPX) → Dealer hedging could push price into 6165-6210 ES (~6140-6185 SPX)
💡 Takeaway: GEX + Harmonics + weekly fib range pointing to a high-probability trigger zone. Don’t oversize here —let price confirm before increasing positions.
Loth’s ES Daily Levels Plan
Solid day dudes! Another +70 ES point sit-and-back-and-relax swing based on our pullback retracement entry (Long 6021 to 6090). Two days in a row, +70 pt ES posted setup. ES perfectly bounced from the prior overnight high harmonic pivot (see last 2 posts) before making a strong push higher. As forecasted, ES also retraced once more to 6030 just before the ISM Services PMI data, a key liquidity zone.
6030 was a key imbalance of buyers which propelled price during the London session. Then ES launched towards our daily target of 6090 (1.414-1.618 PD RTH). Price remained above EMA50 5m all day — which also offered an easier way to enter on pullbacks and signaled continuation a strong trend.
The rally this week was in line with the weekly fib structure, respecting 0.118, 0.236 supports, and 0.618 initial resistance pivots, with the market still recovering Sunday’s massive gap down. Today, ES moved above 6065-71 (Prior Weekly 0.618 Fib) and consolidated around 6081 Prior Weekly VPOC, a very key node for liquidity. The test of 6090-6100 aligned with both the 0.764 Weekly Fib and the top of the daily expansion channel (1.414-1.618 PD RTH purple box).
Gamma exposures remained significant, with not a tremendous volume expiring today, so there was slow-and-steady movement towards the main nodes (6080-6100). 6025 and 6035 acted as a strong put wall, solid support at the opening pullback.
For tomorrow, 6090-6100 is the key range to monitor. If price can hold above, we could see an extension toward 6110-6125. Be more careful, expect a bigger intraday pullback which we did not have in the last two days. If we get an extreme squeeze, target last week’s highs at 6143. The overall structure supports continuation for the LONG side, as price holds above 6055-6060 through Thursday’s RTH — a key demand zone.
However, when price fails to sustain above 6075, expect a pullback to sweep today’s lows at 6055-6065, deeper pullbacks targeting 6030-6040 (large call GEX exposures).
On the calendar, keep in mind tomorrow's Bank of England Interest Rate Decision and Canada’s PMI data. Heading into Friday, be very mindful of an increase in volatility and gamma exposure with Non-Farm Payroll and Unemployment Rate data, so there may be much more sudden price corrections.
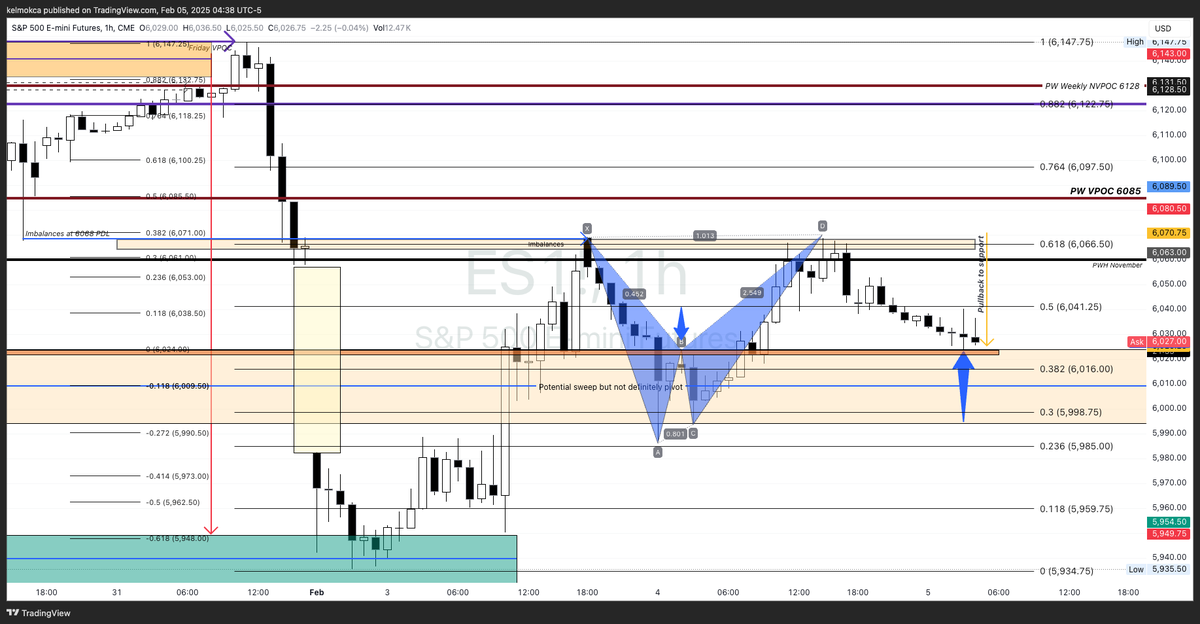
$ES_F SPX retraced Tuesday’s rally through overnight trading, pulling back to the London open high 6021 from yesterday. This level is pretty important today, just near ES6025 (SPX 6000) as it is a high negative gamma exposure level --- a drop below may accelerate selling as dealers will need to hedge the move.
If buyers fail to support, we could see a pullback to 6009, mid-point B-C, or 6012 -0.118 of yesterday's RTH range, and a deeper pullback to 6004 (-0.272), 5997 (-0.414 prior day), 5987 (-0.618 prior day).
The retracement following a Butterfly Harmonic pattern is a useful pattern to observe, because it consistently comes back to the Pivot B due to the large imbalances.
Also, here are fib levels for this full week:
38.2% (6016) -> Initial support if breaks lower
50% (6041) -> Initial resistance on the first bounce
61.8% (6066) -> Yesterday highs
#GOOGL#StockMarket🚀 $GOOGL Trade Setup 🚀
GOOGL rallied ahead of the Q4 earnings report, reaching the 2024 1.272 Fib Expansion of the 2024 1Y range (March low to July highs), rejecting near 209.52. A pullback to 185-187 could be a great buy today after hours, which is a sweep of the upper channel, two-month range (0.118 Fib Level of 183.5 to 206).
Watching 172-179 for a deeper retrace this quarter, but it may not get there this week.
📊 Levels to Watch:
🔹 Support: 187 (After-hours entry LONG), 172-179 (high-confluence zone)
🔹 Resistance: 192.5 (2024 Yearly High), if breaks above look for 194.5 (Prior Week VPOC) to 197.5 (0.618 Monthly) for a potential short.
#GOOGL #StockMarket #Earnings
Today’s price action followed expectations, with 5955-5980 holding as strong support overnight, aligning with key golden fib 0.382 Prior Day RTH (0.618 retracement and key liquidity levels). There were two dips, with the market makers faking out a first breakout. This formed a very strong harmonic pattern after the news of China tariffs came in at 10pm ET. A quick reclaim above 6025 followed after volume ramped up at the 6am-10am window. I took a bunch of longs there and it never came into draw down. A solid rally took us to 6024 then 6055-6065 once the JOLTS jobs data report came out. We saw an initial rejection at the 0.618 Prior Weekly, confirming resistance for the week. This was also yesterday’s aftermarket highs.
The market tested this 6065 a number of times today, so there’s a chance we may retrace lower again to bring back seller liquidity. Look towards 6043 (0.50 Weekly and 10-day volume line on the charts). A further decline may bring us back to the pivot B, the overnight high pivot at 6021.
For tomorrow, 6055-6080 is still the key range to test. We’ll have ISM Service PMI data at 10am ET — another big macro mover that could get us back a break and hold above 6065. If that happens, it could extend to 6090-6100, aligning with the 1.618 Prior Day RTH extension and key liquidity clusters from last Friday’s abrupt sell-off. We have a key Gamma Exposure node at 6080 above and also below at 6030.
If price fails below 6025 from the news (or from news overnight), expect a move toward 5995-6005, a —0.414 to 0.618 PD RTH retracement, where buyers may reload around yesterday’s Globex lows. Don’t expect that either extreme will get tested until after 10am tomorrow.
Today’s session followed our ES Levels Weekly Plan, where we identified 6080 as a key breakdown level and prepared for potential liquidity sweeps of the prior weekly lows. The market held the prior weekly low and accumulation from 5940 to 5955 become clear in overnight trading. As expected, once the market swept 6040, it found initial responsive buyers after a pullback to 6010, a critical level where liquidity had been swept last week, and also once 6050 was swept, buyers stepped in after a pullback to 6025. From there, a gradual accumulation process around EMA100 5m began near the close, signalling the potential for the final breakout.
- If price sustains above 6055, a move toward ES 6080-6103 remains likely later in the week. Particularly, the strong earnings from PLTR today after-hours may give a big boost to tech sectors, which could see yet another short squeeze to bring NQ to all-time highs. The key test is whether sellers will reassert control at ES 6080, or if momentum can push toward the next liquidity cluster above 6105-6143.
- If the market loses 6030 again, expect downside continuation toward 5994-5966, especially if there are again signs of broader bearish rhetoric or some bad earnings for the rest of the week. The market has repeatedly swept lower liquidity zones before reclaiming key pivots, so a deeper test cannot be ruled out.
Critical level
Watching price behaviour near 6080 carefully—breakout or rejection here will dictate the next major move. A failure to hold above 6055-6080 could indicate that supply is still dominant leading to another sweep of lower levels before the next directional move. Keep tabs on 6085 in particular, last week's VPOC, as the market tends to go right back to those levels to the tick.
#ES_F #NQ_F #MarketRecap #FuturesTrading 🚀
Will post some journal entries for ES trades
ES 5240 to 5245
Small scalp for retracement of range breakout following 1.414 expansion + 0.236 retracement of prior 4h RTH. Buyers held EMA20 15m.
Target: retracement 0.618 of prior range, +2-5pt
Max: 0.768 5242.75 of full session
The big move on Wednesday continued through into Thursday’s NY open, expanding further to Wednesday 1.414 fib expansion, 5322.50. The main thing to watch today is whether there's a gap down to Wednesday’s range, 5290 and the PWH are all the way down to 5257.
Just sharing my resource to the community, called Loth's Live Charts.
Daily Key Levels, detailed charting notes, and suggested key entries throughout the day. Follow along on my TradingView charts to track key levels and liquidity imbalances through all trading sessions.