Local bottom: $3527.22, marking the recent rebound starting point.
The current price has rebounded to near the upper Bollinger Band (around $3640) but faced resistance and pulled back.
There is still pressure from the previous consolidation zone around $3670.
If the price continues to face resistance and pulls back, it may retest the $3570–$3600 support zone.
RSI has formed a bullish divergence, suggesting a potential for short entry.
Whale and Institutional Activity:
U.S. Spot Ethereum ETFs recorded $1.3–$2.2 billion in net inflows this week, setting a weekly record and indicating continued large-scale capital inflow.
BlackRock’s ETHA saw over $300 million in a single day, with total AUM rising to over $10 billion. Fidelity and Grayscale followed closely behind.
SharpLink Gaming increased holdings by approximately 80,000 ETH.
The Pantera-backed “Ether Machine” holds about 400,000 ETH, showing that institutions and companies are establishing strategic reserves.
Entry Suggestion:
Break above $3660 with volume → consider entering long
Break below $3610 with volume → consider entering short
Local Top: $3859.98, marking a short-term high;
The current price is fluctuating within the $3720–$3750 range, showing weak sideways consolidation overall;
Key support below lies around $3647, which has been tested multiple times and shown buying interest.
If the price breaks out of the full range — either above $3750 or below $3700 with strong volume — it would signal the next major move. Otherwise, expect continued narrow-range consolidation.
Top region: 3857.82, where a local high was formed, followed by sideways consolidation and then a weak pullback.
Currently, the price is in a weak consolidation range between 3720–3740, with several tests of the lower Bollinger Band, but the rebound strength is limited, showing a bearish consolidation pattern.
The Bollinger Bands are narrowing, indicating reduced short-term volatility and suggesting that the market may be preparing for the next directional move.
Trading volume continues to decline, currently at a low level (as shown by the small volume bars below), indicating that market activity is decreasing, and funds are waiting for a breakout direction.
If the price breaks below with volume, it could trigger an accelerated sell-off.
According to the latest WhaleAlert reports, some large funds are still transferring out of exchanges, suggesting potential profit-taking at high levels in the short term.
There is no strong accumulation or buyback activity observed.
If the price breaks below 3700 with strong volume, it could lead to a further drop, with the next target around 3640.
If the price holds above 3700 and breaks above 3760, it could trigger a new round of upward movement.
"Looking back at the analysis, both the long and short positions were profitable based on the entry points I identified."
ETH Market Analysis for Today
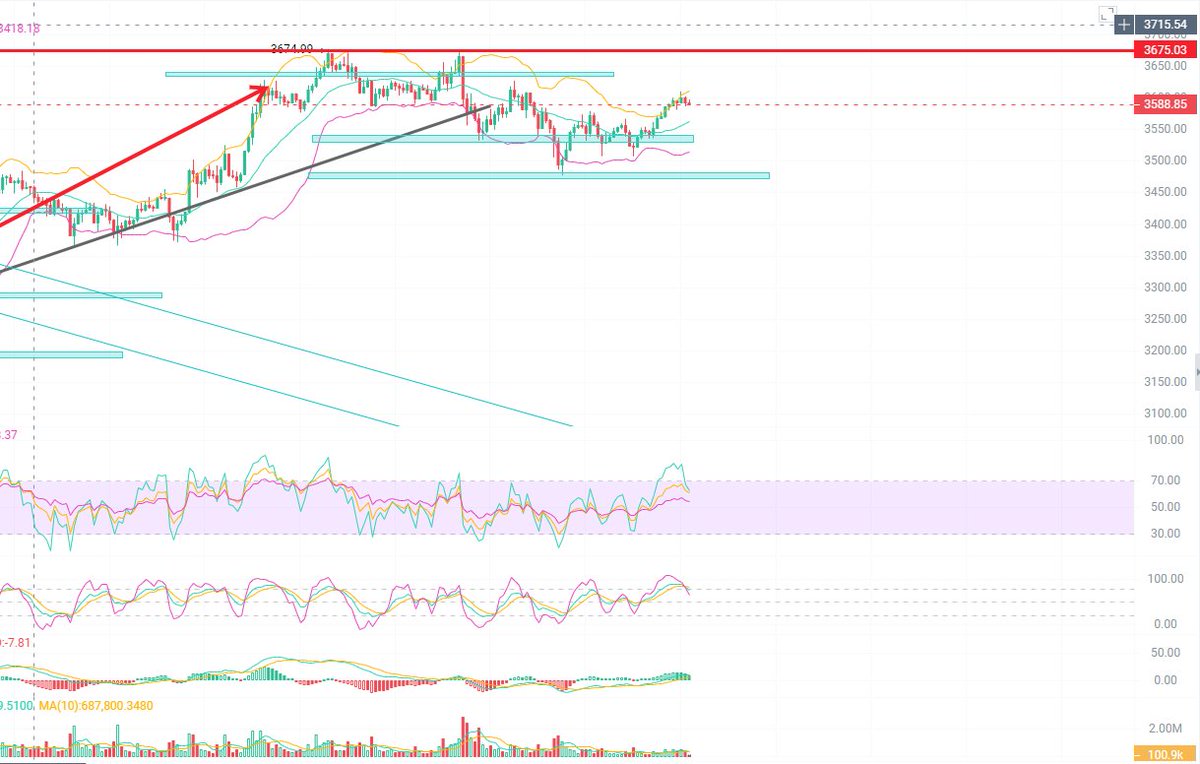
The top was formed at $3674.43, followed by a period of choppy decline.
Currently, a short-term stabilization and rebound structure has developed, with the price just breaking above the Bollinger mid-band and approaching the upper band.
In the short-term structure, the price is still in a phase of “downward correction → rebound test.”
On the 1-hour chart, the histogram has turned from red to green, and the MACD fast line is approaching the signal line. If a bullish crossover occurs, it will confirm a short-term bullish trend.
After recent high-volume pullbacks, the current price rebound remains low in volume. A clear breakout with volume would strengthen the bullish signal; otherwise, it might turn into a false breakout.
Whale Activity
Recent whale buying activity: According to WhaleAlert, whales have continued to accumulate ETH this week, transferring tens of thousands of ETH into exchanges, mostly appearing to be institutional long-term holdings, suggesting buy-side dominance.
However, some whales sold 40,000 ETH to Kraken, causing short-term selling pressure, though it did not lead to a trend reversal.
Another whale rebalanced 26k–150k ETH to exchanges in a single move, which is still ongoing.
Overall, whales appear to be primarily engaged in institutional accumulation, but there is also short-term profit-taking or rebalancing, which temporarily suppresses price.
Summary – Trade Strategy:
Go long in the short term if ETH breaks above $3650 with strong volume.
Go short in the short term if ETH breaks below $3530, especially if whale outflows spike.
ETH has so far reached a high of $3628.
Yesterday, we already predicted that if ETH holds above $3300 and breaks $3423, it would likely push to new highs.
Now, this move has yielded a profit of over 200 points.
🔍 Today's ETH Market Analysis
Current price: $3608.77
Intraday high: $3628.00
Technical Overview:
The uptrend line drawn on the chart has been perfectly respected, indicating the primary trend remains bullish.
While price pulled back slightly today, it never broke below the trendline, showing strong consolidation near the highs.
MACD:
The MACD histogram has slightly weakened, but DIF and DEA remain above the zero line, suggesting momentum has slowed but the bullish trend remains intact.
Volume:
Volume has decreased during the pullback, indicating no panic selling.
Currently, ETH is in a low-volume consolidation phase, likely preparing for the next major move.
���� Whale & Institutional Flow Analysis
📈 ETF inflows remain extremely strong: U.S. spot ETH ETFs saw a record single-day inflow of $727M, with over $2B added since July 4.
🐳 Whale accumulation:
The top 3 whales have collectively added 174k ETH (~$540M) in the past two weeks.
Over 88k ETH (~$300M) has been withdrawn from Kraken and other CEXs to whale wallets, indicating long-term holding intentions.
🏦 Exchange reserves: Centralized exchange ETH balances have dropped, with more than 3.8M ETH exiting to self-custody, signaling reduced sell pressure and broader accumulation.
Summary:
The sustained inflow from ETFs and whales provides a solid foundation for ETH’s rally. Even if short-term pullbacks occur, they appear to be part of a healthy consolidation after capital inflows.
🎯 Trade Strategy (for reference, not advice)
✅ If price holds above $3540 and breaks above $3628 with volume, the target moves to the $3700 range.
⚠️ If ETH breaks below $3540 with strong volume and a MACD bearish crossover, a retest of the $3420 support zone is likely.
No analysis was made yesterday, but based on the previous day's forecast:
If ETH breaks above $2975, it would confirm a continuation of the bullish trend.
Surprisingly, the price surged all the way up to $3423 today, exceeding expectations.
Ethereum (ETH) Market Analysis – Today
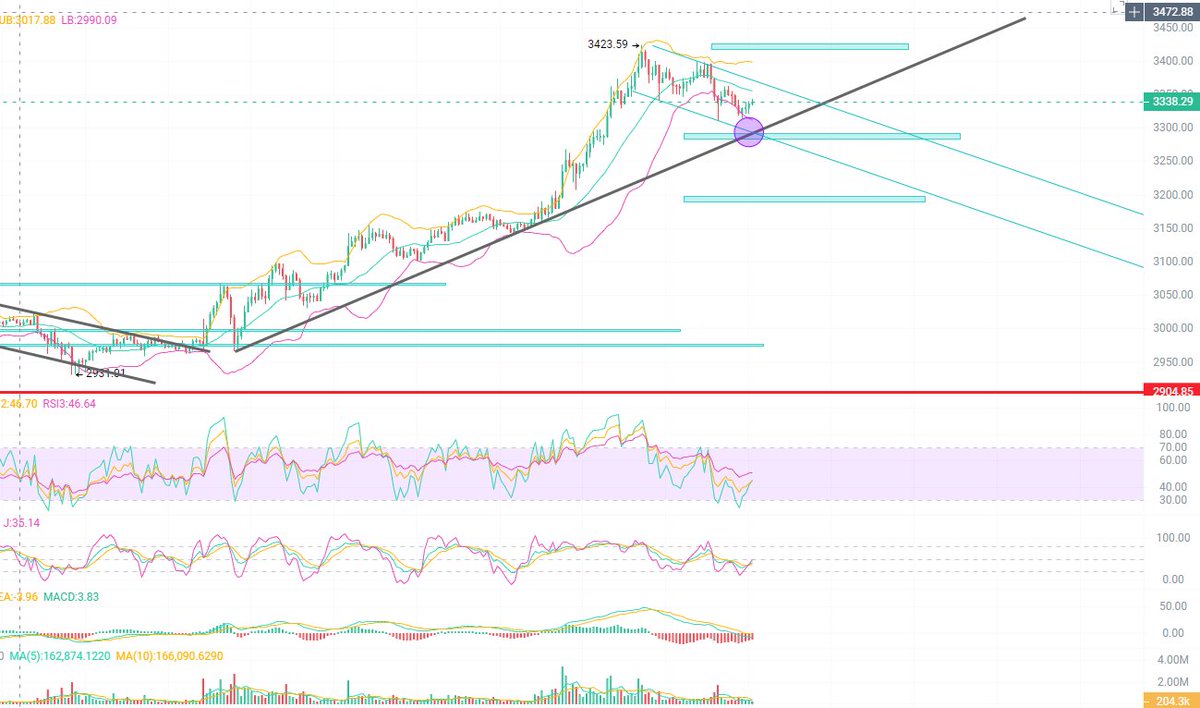
High: $3423.47 – A clear short-term top has formed.
Current price: Around $3330.65 – Price has pulled back from the high, forming a short-term descending channel.
The upper Bollinger Band has started to turn downward, and price has broken below the middle band, now hovering between the mid and lower bands, indicating the correction is not yet complete.
This rally started with a breakout from the $2900 zone, and after a strong move upward, ETH now appears to be forming a potential topping structure.
🔍 Candle Patterns & Momentum
Multiple small bearish candles near the top + decreasing volume;
No strong rebound or volume-backed bullish candles — bullish momentum appears weak.
🔑 Key Level to Watch: $3300
If ETH holds above $3300, there’s a chance to retest the $3423 high;
A break above $3423 could trigger a new leg higher;
However, if ETH breaks below $3300 with volume, it would confirm continued short-term correction;
Next major support to watch would be around $3200.
Yesterday's Outcome:
As expected, ETH broke below the $3000 level and transitioned into a short-term bearish trend. The price reached the first take-profit target, with the daily low hitting $2930.
Today's Trade Outlook:
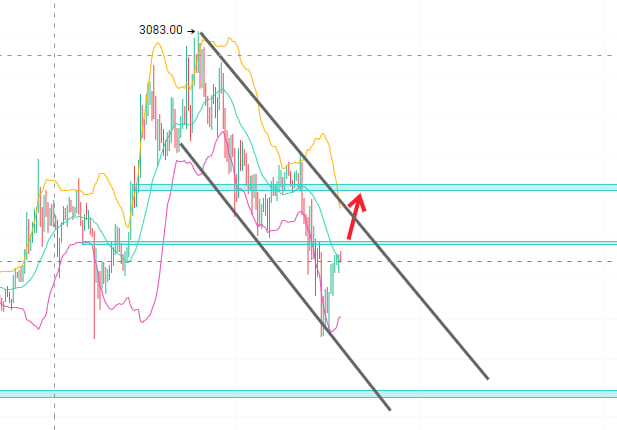
On the 1-hour chart, ETH has clearly broken below the key support zone, confirming a downward structure with strong bearish momentum. Here's today's technical breakdown:
Current price: ~$2940.36, decisively below the $3000–$2975 support zone;
Since the recent high at $3083, ETH has printed 6+ consecutive red candles, indicating solid downside pressure;
Price has broken below the middle Bollinger Band and even closed outside the lower band, suggesting a strong technical breakdown on volume.
Trend Bias:
Today’s price action shows a clear bearish breakdown. Unless ETH can quickly reclaim the $2975–$3000 zone, the probability of retesting $2900 or even lower increases.
Currently, there is no clear sign of a bottoming structure, so traders should watch for any potential low-volume bounces or failed breakouts.
Key Levels to Watch:
If ETH breaks above $2975 with volume and holds, the market may retest the $3000 level;
If ETH fails to break $2975 and resumes downward momentum, we may see continuation toward yesterday’s second take-profit target.
ETH rebounded from around $2900 to test resistance at $3066 yesterday. Now consolidating between $3030–$3050 on the 1H chart after a strong move.
A typical “bullish continuation flag” pattern is forming. If support holds, the uptrend may continue.
📉 Support levels: $3000, $2975
📈 Resistance: $3066 (key), then $3100 if breakout holds
🧪 Indicators: RSI, KDJ & MACD all lean bearish; RSI below midline, suggesting short-term correction likely.
📊 Capital & On-chain Flow:
U.S. ETH Spot ETFs have seen 8 consecutive weeks of inflows, with 61,000 ETH (~$157M) added last week.
In the past 30 days, ETH saw $5.1B net inflow, while Base L2 had ~$4.3B outflow — bullish for ETH dominance.
Overall, capital inflows + active on-chain metrics support ETH’s uptrend base.
📉 Watch $3000 carefully — a break below could signal short-term pullback to $2975–$2900 range.
Trade Setup
📈 Long if price breaks above $3066
Position size: 10% capital
TP1: $3100
TP2: Waiting confirmation
📉 Short if price breaks below $3000
Position size: 10% capital
TP1: $2975
TP2: $2900
📈 Price action followed the plan — breakout confirmed
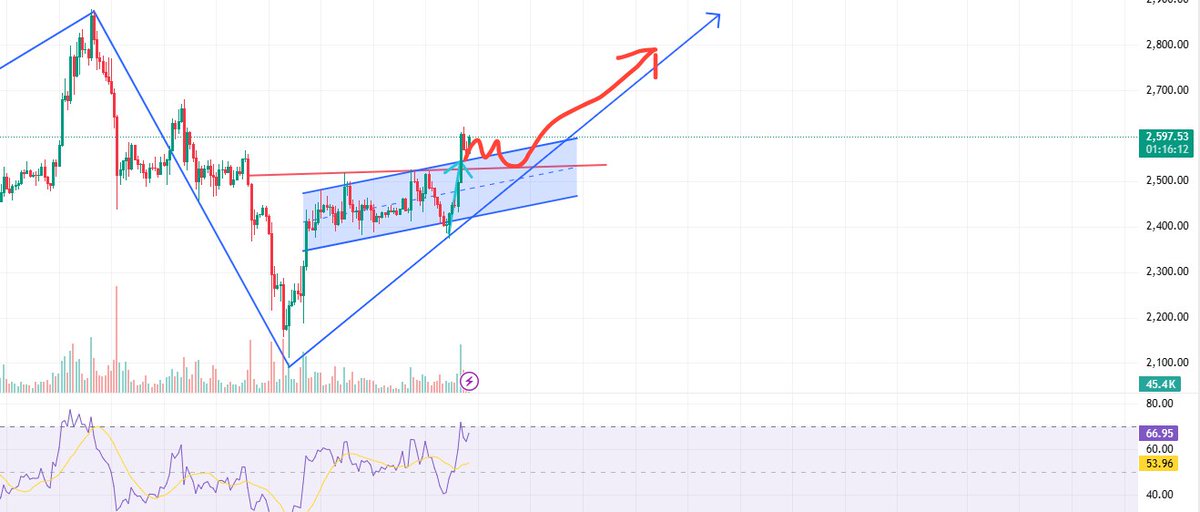
Just as outlined in my previous analysis, price has now successfully broken above the red resistance zone and is holding above it.
No need to chase the move. Now it's all about waiting for a clean pullback entry.
Chart structure breakdown:
✅ V-shape reversal + rising wedge = played out
✅ Breakout came with volume = confirmed
✅ RSI back in bullish zone = supports trend continuation
📌 Most likely scenario:
Pullback → retest → continuation
(Red path in the chart shows the expected move.)
📍 Focus on pullbacks to key levels — either the red horizontal zone or top of the wedge.
Let the market come to you — don’t force entries when structure is already extended.
All views shared are for personal tracking and educational purposes only.
This is not financial advice. Always DYOR and manage your risk.
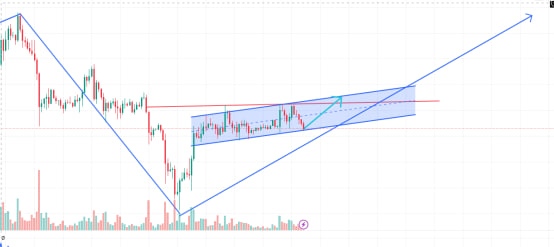
The current price action shows a classic V-shaped reversal followed by a rising wedge formation, now entering a key decision zone before potential breakout.
1.After a steep drop, the market formed a strong V-recovery, indicating heavy buying interest and a clear short-term bottom.
2.Price then entered a rising wedge (ascending channel) structure — volatility is narrowing, but both highs and lows are climbing steadily. This is often a sign of pre-breakout compression.
3.The two blue circles highlight key contact points with the wedge boundaries — areas of significant market decision and reaction.
4.The red horizontal line represents overhead resistance. A confirmed breakout with volume could lead to a break → retest → continuation structure.
Bias: Bullish breakout — current price action sits near the wedge’s midline with healthy consolidation.
Key levels to watch:
🔵 Support: Lower wedge boundary. If lost, the setup is invalid.
🔴 Resistance: Red zone. If price breaks above this level with volume, the measured move becomes likely.
📉 Volume has been gradually declining — a classic sign of an upcoming move. The setup looks coiled, ready for expansion.
This is my personal technical view, not financial advice.
Markets move fast. Think for yourself and manage your risk.