ACBI/MCMI. GOLD/SILVER = Save/Protect to beat 2027 rush into Safe-Haven Precious Metals; best hedge against USD weakness, Bond collapse/Stagflation?
@LowerCosta
You could add the years below too!
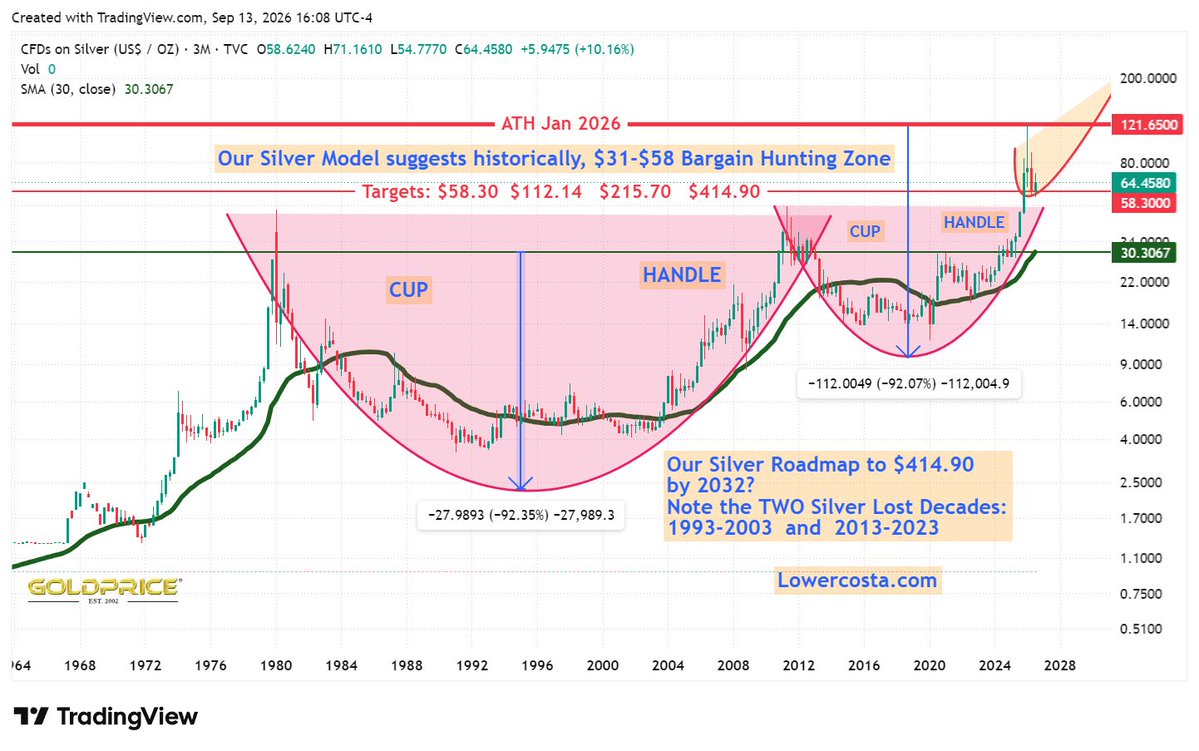
Note the TWO lost #Silver Decades 1993-2003 and 2013-2023. Timing is everything. Also note our 4 targets based on the large Cup and Handle - after our forecast 52% estimated retrace in 2026.
Without #Gold Revaluation, $415 oz Silver is our forecast by 2032. There will, of course, be many retracements on the way to $415, but remember - 90% of the move comes in the last 10% of the time, so
$215-$415 could be the parabolic fast move in this cycle.
https://t.co/robyniAtuH
2018: “Silver is dead”
2022: “Silver is dead”
2025: “Why didn’t I buy Silver?”
2026: “Silver is dead”
2030: “Why didn’t I buy Silver?”
They will call us lucky.
The Gold/Silver Ratio is an important piece of the puzzle.
A sustained move below its 144-day SMA would strengthen the case for silver outperforming gold.
That would fit well with the strong bullish reaction I'm expecting from silver's current support zone.
The key now is confirmation through price and momentum.
Interesting to see the #GSR (Gold:Silver Ratio) Dinosaur is back!
Our 5 targets to reach 45:1 on our chart below (currently 77:1). However, it needs to hit and maintain below 67:1 Daily SMA.
Likely that the 80:1 will be the 2026 GSR High.
🥈 SILVER | Setting Up for a Strong Bullish Rebound
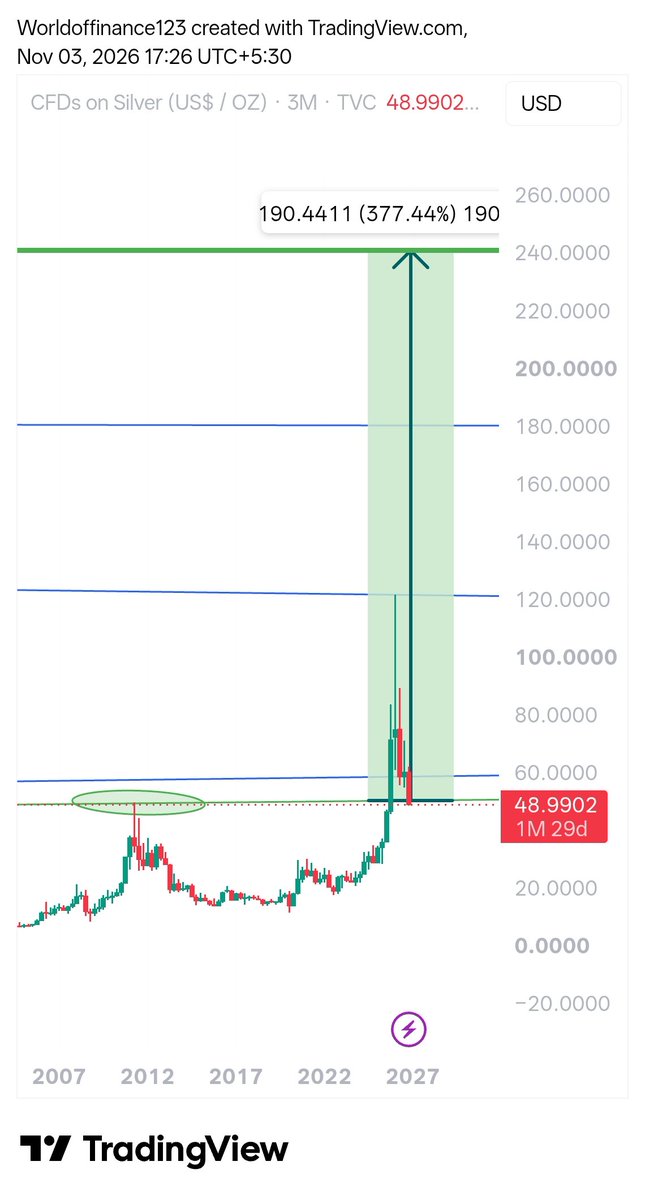
Silver is starting to bounce off a major support zone around $48–$50, following an extended correction within a descending channel.
The primary uptrend remains intact, and from a technical perspective, a strong bullish reaction from these levels would be the logical scenario.
For that to happen, price needs to accelerate higher, build momentum, and allow the technical indicators to gradually improve after the recent correction.
The Woodies CCI is beginning to show signs of recovery from oversold levels, while the momentum oscillator still needs confirmation.
Support is holding. Now we need price to accelerate and momentum to follow.
#Silver #PreciousMetals #TechnicalAnalysis
#Gold's Next Move: Buy Now or Wait?
It's been a turbulent couple of weeks for gold which has left investors pondering their next move.
The Democratic midterm sweep and renewed hopes of a resolution in Iran offered some support end of last week.
However, Headwinds incoming! Friday's unexpectedly strong US jobs report was followed by hotter-than-forecast inflation on Tuesday, pushing US bond yields higher and making another Fed interest rate rise in Dec 2026 almost certain - 0.25-0.50 expected).
That leaves buyers facing a familiar dilemma as the metal's longer-term appeal remains despite the immediate headwinds, with Central Banks continuing to accumulate gold and government debts mounting.
The next triggers to look for this week will be Friday's US producer inflation figures, whilst developments on a resolution in the Middle East could also come to the fore. Interesting, if volatile times!
Gold swaps via BIS soar, indicating heightened price suppression efforts
Surreptitious efforts for #Gold price suppression conducted through the
Bank for International Settlement (BIS) in Basel, Switzerland, soared in September and October.
'the bank's gold swaps rose from 141 tonnes at the end of August to 165 tonnes at the end of September and to 218 tonnes at the end of October, an increase of 55% in just two months.'
Source: https://t.co/9aXJD0MgzD
Another day in Paradise (Not) for PM's, especially #Silver down 3.7% after Oct CPI released today. Shelter up 0.3%, Food up 0.5% and Energy up 0.7%.
I warned that Big Bro #Gold, and Little Sis Silver would struggle until the end of 2026 - after Fed Rate Decision on 9th Dec.
A FULL ROUND TRIP has been completed by The Devil's Metal $48.61 oz from Nov 2025 - Nov 2026.
Risky Zone sub $64.82, which we expect to be reached early Q1/27.
Hotter-than-expected US inflation raises prospect of a larger December Fed hike: Following the release of October CPI, which showed both headline and core inflation rising more than expected, markets have moved to fully price in a 25-basis-point rate hike at next month's FOMC meeting. The question now is whether traders will begin positioning for a larger 50-basis-point move following Fed Governor Waller's hawkish comments earlier today.
The repricing has triggered a sharp bear flattening of the US Treasury yield curve, with the policy-sensitive two-year yield rising 11.5 basis points compared with a 5-basis-point increase in the ten-year yield, narrowing the 2s10s spread by 6.5 basis points. The move highlights growing concerns that persistent inflation will force the Fed to maintain a restrictive policy stance for longer, potentially at the expense of economic growth. Meanwhile, the sharp rise in December 2027 SOFR-implied rates relative to December 2026 suggests markets are also reassessing the longer-term policy outlook, with fewer rate cuts, or potentially additional tightening, being priced beyond next year.
However, the risk for those betting on further tightening, especially a larger 50-basis-point hike, is that inflation pressures may already be easing. While the November CPI report will not be released until after the December FOMC meeting, signs of moderating price pressures - through lower energy prices - in the intervening weeks could put a spanner in the works of an increasingly hawkish market. Such a development would leave the Fed facing a difficult balancing act between responding to backward-looking inflation data and avoiding excessive tightening just as underlying price pressures begin to subside.
#Gold#Silver
The main trigger today is a sharp hawkish turn in #Fed rate expectations. Fed Governor Christopher Waller said the Fed should raise rates in Dec 2026 even if inflation cooled, and could consider a larger half-point hike if inflation stays hot. That pushed short-term Treasury yields up and helped steady the #USD—both tend to weigh on PMs because they pays no interest. Traders were also trimming positions after Monday’s rally ahead of today’s US CPI report.
They could fall further. No safe entry points until after Wed 9th December 7:00 p.m. UK time re Fed Rate Decision.
The US’s biggest export is gold, and most of it is going to China.
China is basically telling the world:
Trade with us in yuan.
Don’t trust the yuan? Convert your surplus into gold.
Store it locally. We’re building vaults abroad, outside
Western financial centers.
You don’t have to trust China.
You don’t have to trust the yuan.
You just have to trust gold.
Trust between nations is collapsing, and China is using gold’s 5,000-year monetary history to expand the yuan’s role.
It’s the dollar’s weaponization playbook in reverse.
We don’t own enough gold for what is coming.
🚨 WARNING: SOMETHING EXTREMELY BAD JUST HAPPENED!!
New macro data just dropped and it’s FAR WORSE than anyone expected.
99% of people will lose everything.
Not because of a recession.
Not because of another banking crisis.
Not because of the U.S.-Iran war.
The REAL danger is silently unfolding behind the scenes.
And it begins with sovereign debt, particularly U.S. Treasuries.
Bond market instability is accelerating.
The MOVE index is climbing, signaling growing stress behind the scenes.
Bond markets don't react to headlines alone.
They react when liquidity disappears and funding conditions deteriorate.
And today, 3 major financial issues are approaching simultaneously:
1️⃣ UNITED STATES
In 2026, America faces enormous refinancing requirements alongside record government deficits.
Debt servicing costs are climbing.
Overseas Treasury demand is weakening.
Long-term bond auctions are showing increasing signs of stress.
Less demand.
Higher borrowing costs.
Tighter liquidity.
This is precisely how a funding crisis starts.
2️⃣ JAPAN
Japan remains one of the largest foreign holders of U.S. Treasuries and a critical pillar of global carry trades.
The BOJ is already tightening policy.
Japanese investors are forced to liquidate foreign assets, including U.S. bonds, stocks and ETFs.
At the same time, a Japanese stock market crash will accelerate global risk aversion and trigger further selling.
Japan won't just feel the shock.
It'll transmit it across the global financial system.
3️⃣ CHINA
China's debt crisis is becoming impossible to ignore.
Its property sector, local-government financing problems and weakening domestic demand are creating enormous pressure.
The recent 45% collapse in the Chinese stock market has already weakened confidence.
China will become another major amplifier of global financial stress.
And the trigger doesn't need to be spectacular.
One failed Treasury auction could be enough to expose everything.
We've witnessed similar events before, including the UK bond crisis in 2022.
But this time, these issues are interconnected across multiple major economies.
The chain reaction will be brutal:
Bond yields explode again → Dollar surges → Liquidity evaporates → Global equities collapse
Then central banks intervene.
Emergency liquidity → Currency swap lines → Balance sheet expansion
The immediate panic stops, but the financial system becomes flooded with extra liquidity.
Real yields decline → Gold surges → Silver follows → Commodities rally → The dollar eventually weakens.
The next inflationary wave begins.
the 2026–2027 cycle will be a defining period for global markets.
The biggest threat isn't one isolated economic crisis.
It's multiple financial pressure points reaching breaking a point at the same time.
The warning signs are already here.
The time to pay attention is NOW.
I've spent over 12 years studying financial markets and calling nearly every market top and bottom.
The next few weeks will separate those who are prepared from those who will lose everything.
Follow and turn on notifications.
Many will wish they had paid attention sooner.
#CPI#XAUUSD#GOLD#FED#USA#UK
Today’s U.S. CPI report features only month-on-month figures—no year-on-year data!
A calculation formula reveals the data gap left by last year's US government shutdown.
Where are we now?
#Gold: The immediate support is a softer #USD, lower oil prices and continuing Central Bank demand. China's central bank bought 26 tonnes of gold in Oct 2026, its largest monthly purchase in 3 years.
#Silver: The #GSR at 78:1 is worth watching. Silver has considerable 66% industrial exposure as well as investment demand. If confidence improves and industrial demand strengthens, silver could outperform gold; if economic growth weakens, that same industrial exposure can work against it.
#InterestRates: US October payrolls increased by 165k, compared with expectations of 65k. Unemployment fell to 4.1%. The 10-year Treasury yield rose to around 4.87%, while the two-year reached approximately 4.52%. This is a headwind for PMs.
#Miners: Gold mining costs: margins are still attractive, but costs are rising. Example:
#AEM Q3/26 highlights:
Gold production: 814,012 Oz.
Realised gold price: $4,264/oz.
AISC: $1,648/oz (up $317 on Q3/25 UP 24% YOY).
Quarterly FCF: $852 million.
Net cash position: $3.5 billion.
AISC has risen due to diesel, labour, lower production at certain mines and higher royalty costs. Its 2026 production outlook is near the lower end of guidance, with costs near the upper end.
Agreed. Our 2027 #Silver target is the 1980 inflation adjusted ATH of $50 ... Now $195 Oz.
One "X Account" today suggested $1,000 Oz Ag, and $10,000 #Gold by 31.12.2026!
I thought I was the permabull... Mind you, anything is possible if Gold gets revalued at $10k.
Agreed EG.
Despite short-term price volatility, institutional accumulation remains robust: #Gold investment funds logged a 4th consecutive month of inflows ($2.7B in Oct 2026), Q3/26 Central Bank purchases rose 42% yoy to 321 tonnes, and China extended its strategic bullion acquisition 24 consecutive months.
Now, #Silver needs to weather the CPI/PPI/Fed Dec decision and then look forward to 2027 with confidence. See our 2027 Silver Targets below.
NB: The 1980 Inflation adjusted high is $195!
#Silver ~ When silver kissed $120usd in last week of Jan 2026 i never thought we would see silver under $50usd ever again let alone in same year. I can now finally start to implement proper "dollar cost averaging" strategies in silver again (Physical & Paper) in Nov 2026 $SLV $AG
Several people have asked today if #SIL and #SILJ are about to go ballistic?
It's possible, but we follow the #HUI for sentiment in the #Gold Miners (and therefore shortly afterwards the #Silver space also).
We said back in Feb 2026 when the HUI was nearing 1,000 level, that a HUI pullback to 638-652 area was likely.
Today, it stands at 737 with old high 986 possible by Q1/27. Target 1 then 1,044 and Target 2 @ 1,419 area.
Gold and silver are up today... But miners are soaring.
Despite the pullback, miners are still the most profitable sector in the S&P...
They've never had this much cash.
Meanwhile, the underlying fundamentals for gold and silver couldn't be better.
The age of mining is upon us.
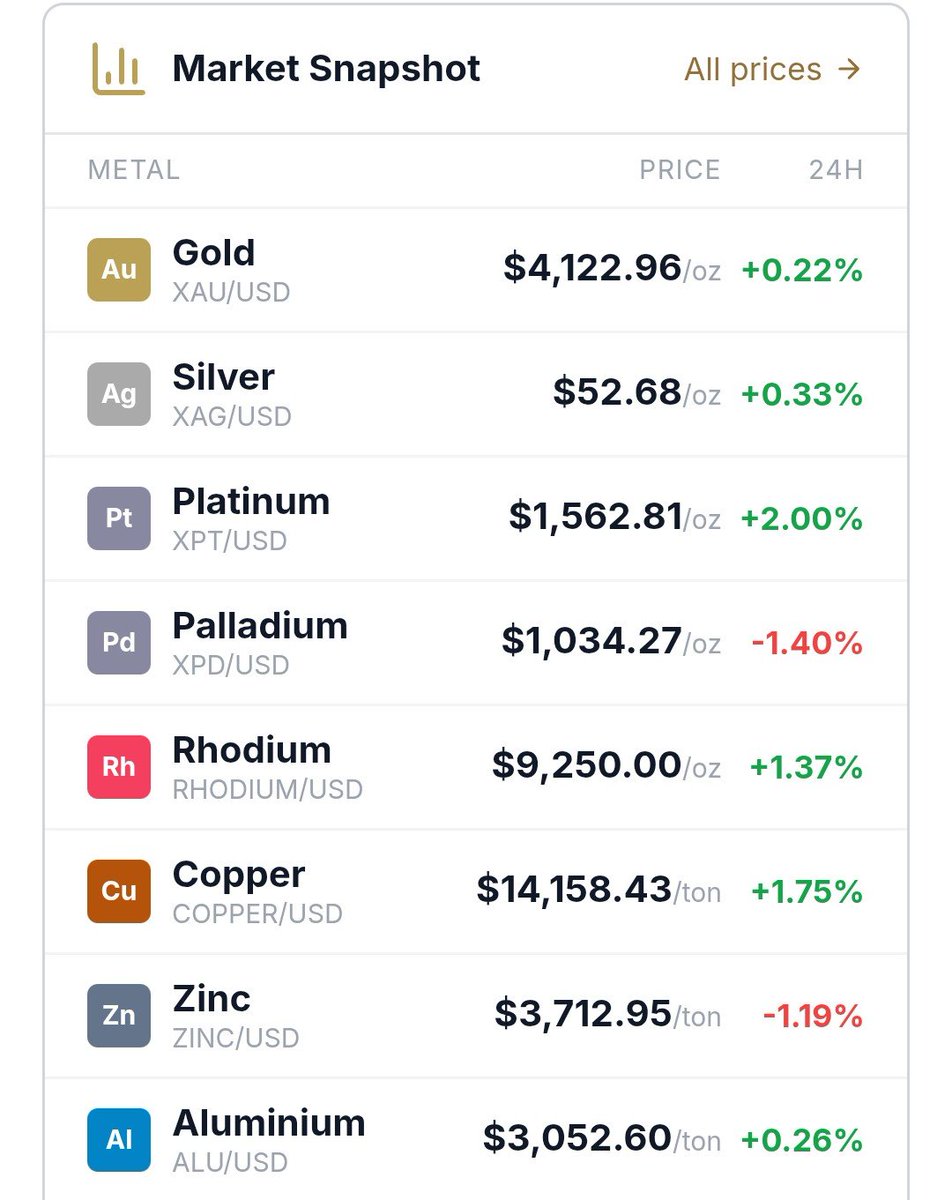
#Platinum is too early to buy yet. However, it is worth keeping on your radar. On WATCH at $1,605 Oz.
Remember: Approximately 10,000 tonnes of platinum have ever been mined.
Approximately 222,600 tonnes of #Gold have been mined. That makes the historical platinum production base roughly 22 times smaller than gold's.
The vast majority of U.S. investors can barely spell #GOLD , let alone own it at this point.
But with two of their favorite choices blowing up in their faces (Crypto and AI), they will be when new, all-time highs are being made.
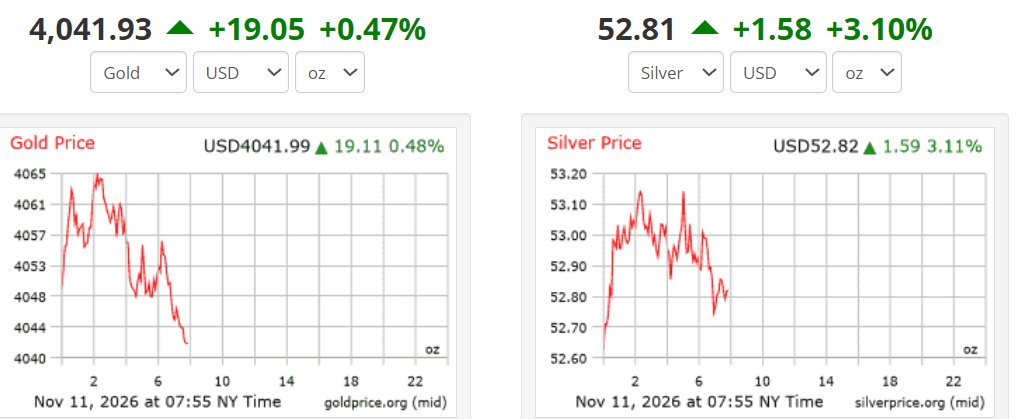
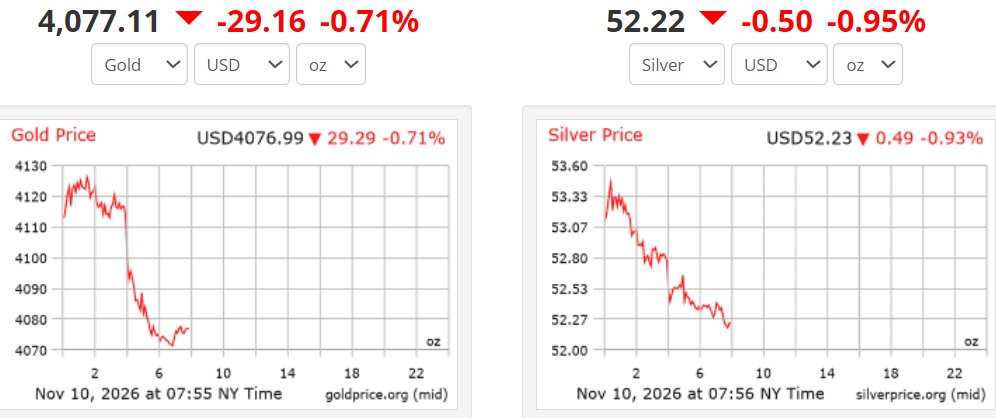
Silver spiked +2.8% to $53.31 and gold retook $4,100 as softer oil eased inflation fears.
Rally cooling now — silver +1.2%, gold +0.65%.
CPI tomorrow 8:30 AM ET is the big test.
Full breakdown:
https://t.co/i6RZUaJO8Q
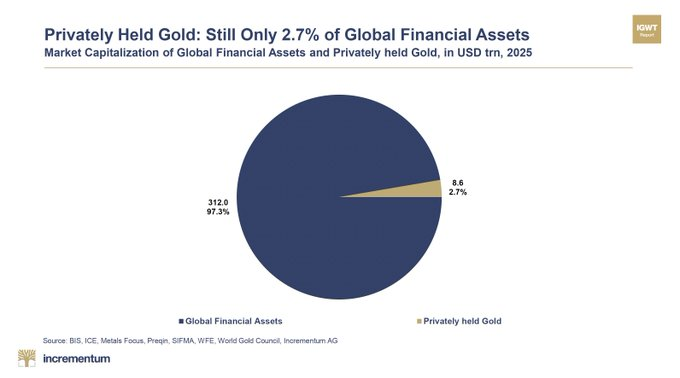
Almost no one is holding gold... just 2.7% of global financial assets.
Meanwhile:
- Global debt is surging
- US M2 money supply is growing at the fastest pace in 5 yrs
- Almost every major economy is running persistent deficits
- Global bond markets are blowing up
In other words, debt keeps piling up, the money supply keeps expanding and governments need even more debt to service existing debt.
If this were a company, it would go bankrupt.
Governments don't go bankrupt. They devalue the currency and make you pay for their fiscal irresponsibility through inflation.
Gold is the natural insurance against that.
You buy insurance before the crisis.
By the time everyone wants it, the premium, in this case the gold price, has already adjusted.
Indeed LE.
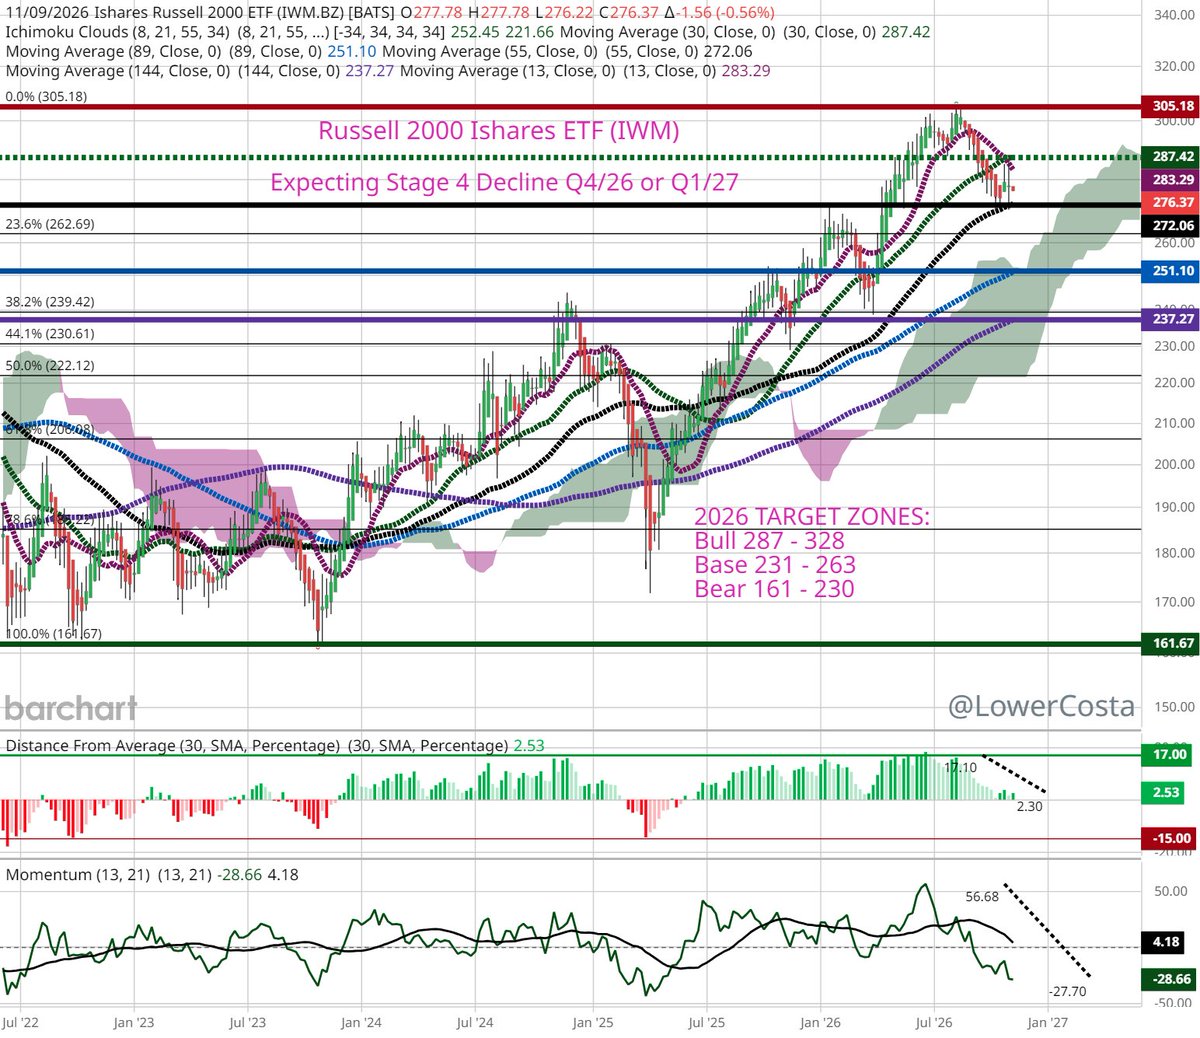
We don't like the look of the EWS - Early Warning System for the #IWM Russell 2000 Small Caps and broader equity markets.
The 10th Aug ATH at 305.18 looking more like the top every day; DIFA and MOM fallen off a cliff.
The 272.06 level to hold is critical - if this goes the 230-239 range comes into play.
SILVER MINERS: EXTREME MARKET BREADTH — IS A MAJOR RECOVERY BEGINNING?
Silver mining stocks staged an impressive rebound during the week ending November 6, 2026. SIL gained 11.38%, SILJ advanced 10.23%, and the median weekly return across the SIL–SILJ universe reached approximately 10.1%.
However, the most interesting development lies beneath the price recovery.
On November 3, only 6.12% of the securities in our daily breadth universe were trading above their 200-day moving averages. By November 6, that figure had recovered to 18.37%.
This raises an important question: Have similarly extreme breadth conditions historically preceded sustained recoveries in silver mining stocks?
To investigate, we analyzed SIL, SILJ and market breadth between November 2012 and November 2026, identifying 18 completed historical episodes in which breadth recovered above 10% after two consecutive sessions below that threshold.
THE HISTORICAL EVIDENCE
Median returns following these signals:
• After 20 sessions: SIL +2.16% | SILJ +1.99%
• After 40 sessions: SIL +10.65% | SILJ +11.07%
• After 60 sessions: SIL +11.01% | SILJ +13.18%
These figures compare favorably with the slightly negative median returns observed across ordinary trading dates.
At first glance, extreme breadth deterioration followed by an initial recovery appears to have been associated with stronger medium-term performance.
But the robustness tests reveal an important limitation.
When we compared these signals with periods of similar preceding price declines, the apparent advantage became less convincing, particularly for SILJ.
More importantly, increasing the minimum separation between signals from 20 to 60 trading sessions reduced the sample from 18 to 11 completed episodes.
Under this stricter approach, the 60-session median return declined to:
• SIL: +1.62%
• SILJ: −1.00%
This substantial reduction suggests that part of the apparent historical advantage may reflect the natural recovery following significant price declines rather than the independent predictive power of the breadth signal.
WHAT DOES THIS MEAN FOR THE CURRENT MARKET?
The recent rebound in SIL, SILJ and market breadth is encouraging. Nevertheless, more than 80% of the daily breadth universe remains below its 200-day moving average.
A more convincing structural recovery would require sustained expansion in market participation, continued price strength and stronger confirmation from trading volume.
History also reminds us that powerful initial rebounds do not necessarily mark the final market bottom. Some extreme breadth episodes preceded sustained recoveries, while others were followed by renewed weakness.
CONCLUSION
Extreme market breadth deterioration has historically been associated with some powerful medium-term recoveries in silver mining stocks.
However, the results are sensitive to signal selection and become considerably less compelling under stricter robustness tests.
The historical association is interesting, but its independent predictive power remains unproven.
The current rebound deserves attention, but there is not yet sufficient evidence to conclude that a durable market bottom has formed.
For now, sustained improvement in market breadth and broader participation would provide more meaningful confirmation than attempting to predict the exact bottom.
FULL RESEARCH
Historical analysis, robustness checks and complete interactive ranking of 98 SIL–SILJ instruments:
https://t.co/1SSmiTxMmY
#Silver #SilverMiners #SIL #SILJ #MarketBreadth #MiningStocks
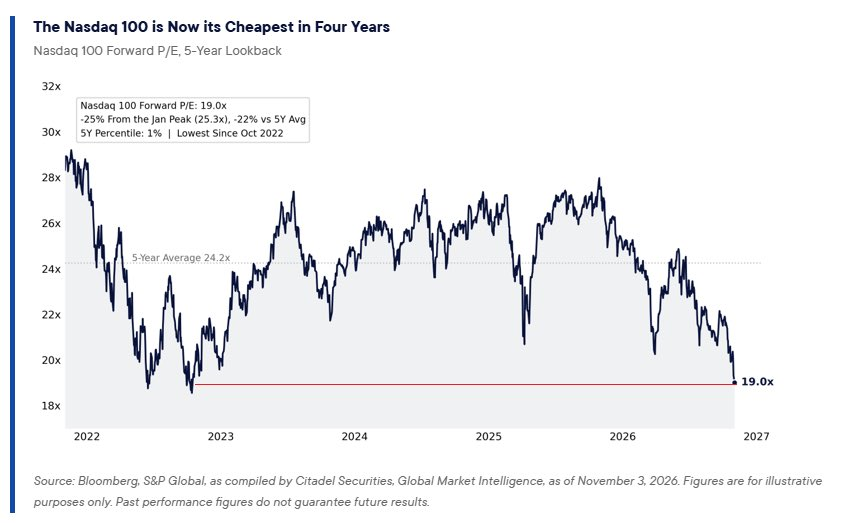
We warned everyone back in June 2026 that a roll over of the #SPX was overdue, and that the #QQQ would be the catalyst for their Stage 4 Decline phase.
Bad news for equities, but good news for #Gold and , #Silver - they should now attract safe haven funds. The PMs have already had their Stage 4,and are now in the Stage 1 Basing phase.