With a deep focus on corporate financial analysis ,this expert specializes in dissecting balance sheet and profit-loss statement true growth trajectories.
#XAUUSD#GOLD#FED#USA#UK
In terms of current short-term market dynamics, the gold price is consolidating sideways at low levels.
The range-bound pattern persists, with the primary overhead resistance zone concentrated around the $4,030–$4,045 level.
This zone marks both the lower Bollinger Band of last week's trading range and the first critical hurdle that the bulls must overcome to launch a counterattack.
On the downside, the most crucial support levels to watch are last week's low of $3,960 and the earlier low of $3,940.
As long as the price holds above the $3,940–$3,960 support zone, the market remains in a low-level sideways consolidation.
Only if the price continues to fall and breaches this level will the door open for a new leg of the downward trend.
At this stage, the short-term market lacks a clear directional signal, and participants are awaiting upcoming data and indications of a breakout.
However, for the time being, short-term range-bound consolidation is expected to remain the norm.
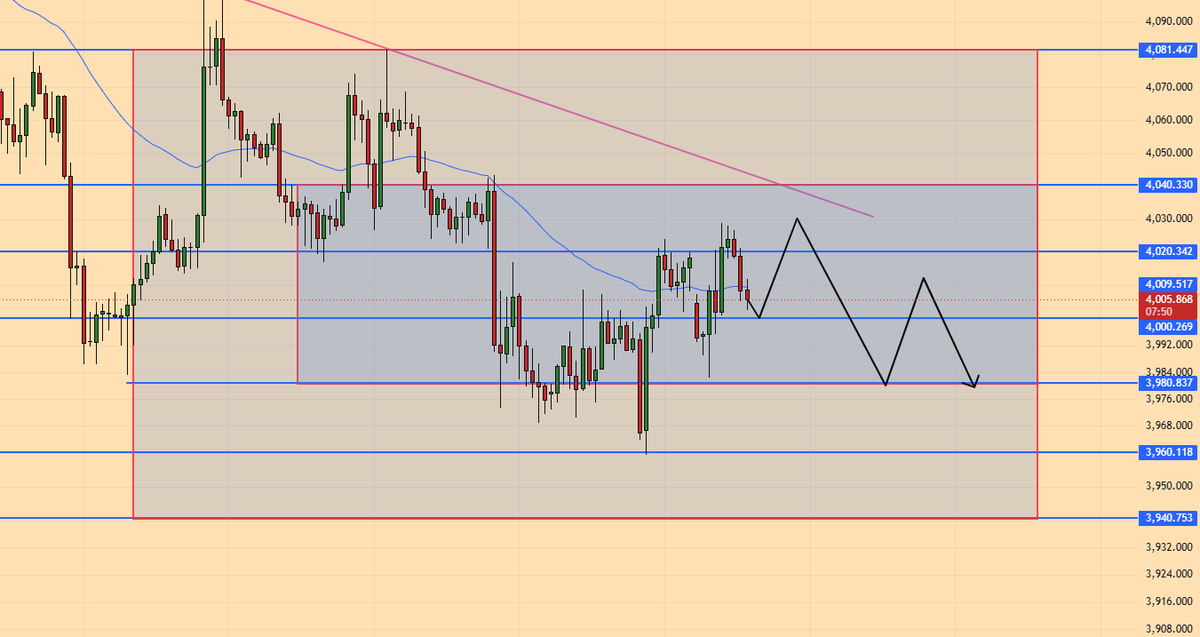
Analysis of the four-hour chart identifies two key trading ranges; the primary short-term oscillation zone is $3,980–$4,030.
Should a rebound break through this level, the focus would shift to the next range of $4,030–$4,080.
Trading strategy should adhere to the principle of following the trend upon a breakout: a decisive drop below $3,980 would see the bears push toward the previous lows of $3,940–$3,960.
Conversely, if the price breaks and holds above the $4,030 level, one should consider following the bullish momentum.
In the short term, the key level to watch is $4,000; a drop below this mark would target the $3,980–$3,960 range.
If the price finds support at the $4,000 level, the initial strategy would be to enter long positions, targeting $4,020–$4,040.