Your next profitable trade could be the most expensive trade of your career.
Not because of how much you make.
Because of what it teaches you.
A bad decision that gets rewarded doesn’t increase wealth.
It increases confidence in a flawed process.
From that moment, the market has stopped paying you.
It has started financing a future mistake.
Professionals understand something that statistics cannot show.
Every trade has two returns.
One is financial.
The other is behavioral.
The first appears in your account.
The second quietly shapes every decision that follows.
Most traders celebrate profitable trades.
Very few ask a more important question
“If I repeated this exact decision 1,000 times, would I still want it to define my career?”
That single question separates people who trade for today’s outcome from those who build a profession that survives tomorrow.
Stagflation Echoes: 10-Year Yields and Oil Mirror the 1970s ... Only Faster🚨
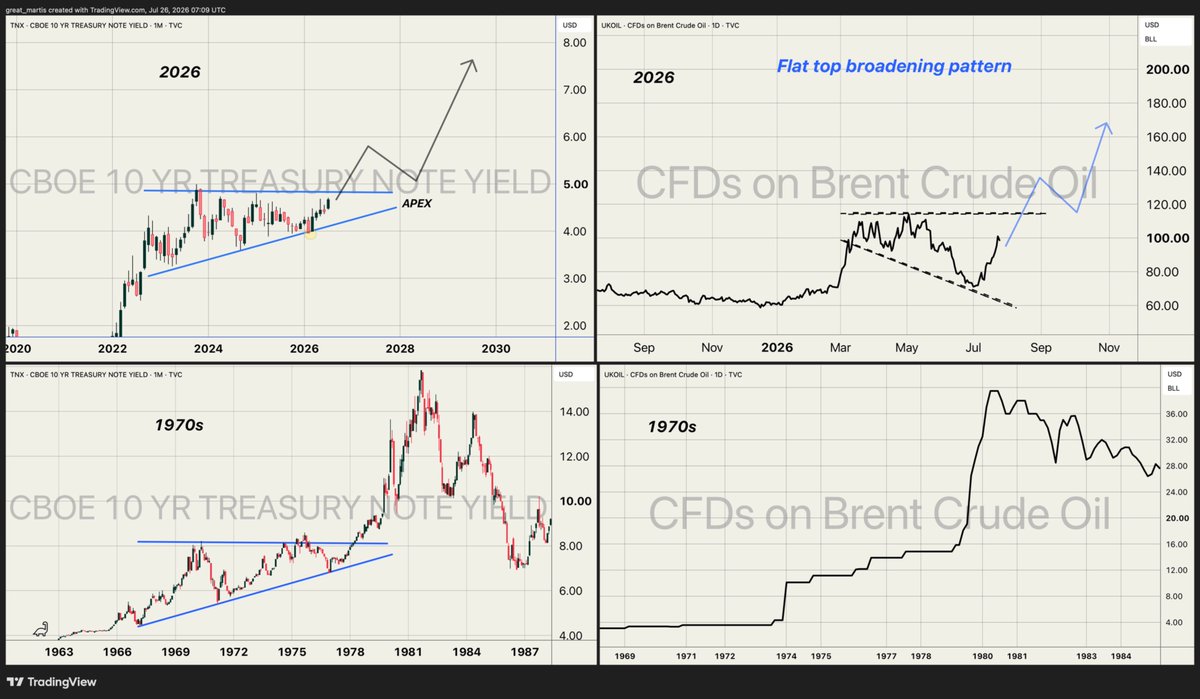
Today’s charts of the CBOE 10-year Treasury yield and Brent crude reveal a pattern that should unsettle every leveraged balance sheet on the planet. The upper panels show the present trajectory; the lower panels show the 1970s. The structural similarities are not subtle.
In the 1970s, rising yields and a primary commodity shock (oil) produced the classic stagflationary trap: inflation accelerated while growth stalled. Debt became harder to service, real incomes eroded, and policy tools proved inadequate. We are watching the same sequence unfold again .. compressed into a far shorter timeframe.
The upper-right panel highlights a flat-top broadening pattern in Brent. Every time oil tests or approaches $100, official narratives of “deals progressing” and “talks going well” intensify. Markets are being asked to treat these statements as credible risk mitigants. History suggests otherwise. Oil remains the marginal price setter for broader inflation expectations; when it breaks higher, the transmission into consumer prices and corporate costs is rapid and difficult to reverse.
The yield charts are equally instructive. The current uptrend in the 10-year mirrors the 1970s advance, complete with intermediate consolidations that ultimately resolved higher.
The difference is velocity: what took a decade then is unfolding in few years now. An indebted, yield sensitive global economy has far less tolerance for this environment than it did fifty years ago.
Central banks face a narrower set of options. Cutting policy rates risks further inflationary pressure and currency instability. Quantitative easing has already expanded balance sheets to levels that constrain further aggressive expansion. Fiscal space is limited in most major economies. The conventional toolkit is largely exhausted precisely when the combination of sticky inflation and slowing growth is most dangerous.
Many will argue “this time is different” better institutions, more sophisticated markets, deeper capital buffers. Those differences exist, yet they cut both ways. Global debt to GDP is substantially higher, supply chains remain fragile, and geopolitical fragmentation has reduced the elasticity of commodity supply.
The margin for error is thinner, not thicker. The horses have already left the stable. Even decisive policy action would take considerable time to restore equilibrium. In the interim, the combination of rising real yields and elevated energy prices is a nightmare scenario for highly leveraged households, corporations, and sovereigns. Chaos is inevitable, the path that avoids it is narrowing rapidly.
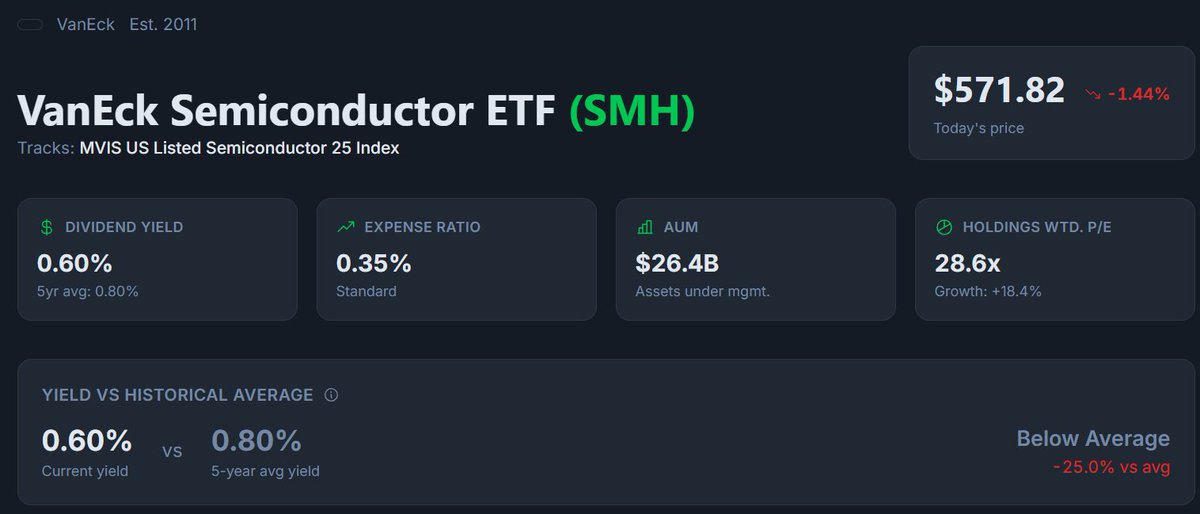
$SMH VanEck Semiconductor ETF overview:
Current price: $571.82
AUM: $26.4B
Expense ratio: 0.35% (standard, not the best)
Dividend yield: 0.60% (lower than the 0.80% average)
$SMH is the largest U.S.-listed semiconductor ETF, holding the 25 most liquid global chip compan
How to Survive? CASH IS KING. 💵
Cash is the only position that lets you choose your moment instead of having it chosen for you.
It’s not idle money. It’s the option on every future price.
The market teaches this rule to everyone eventually.
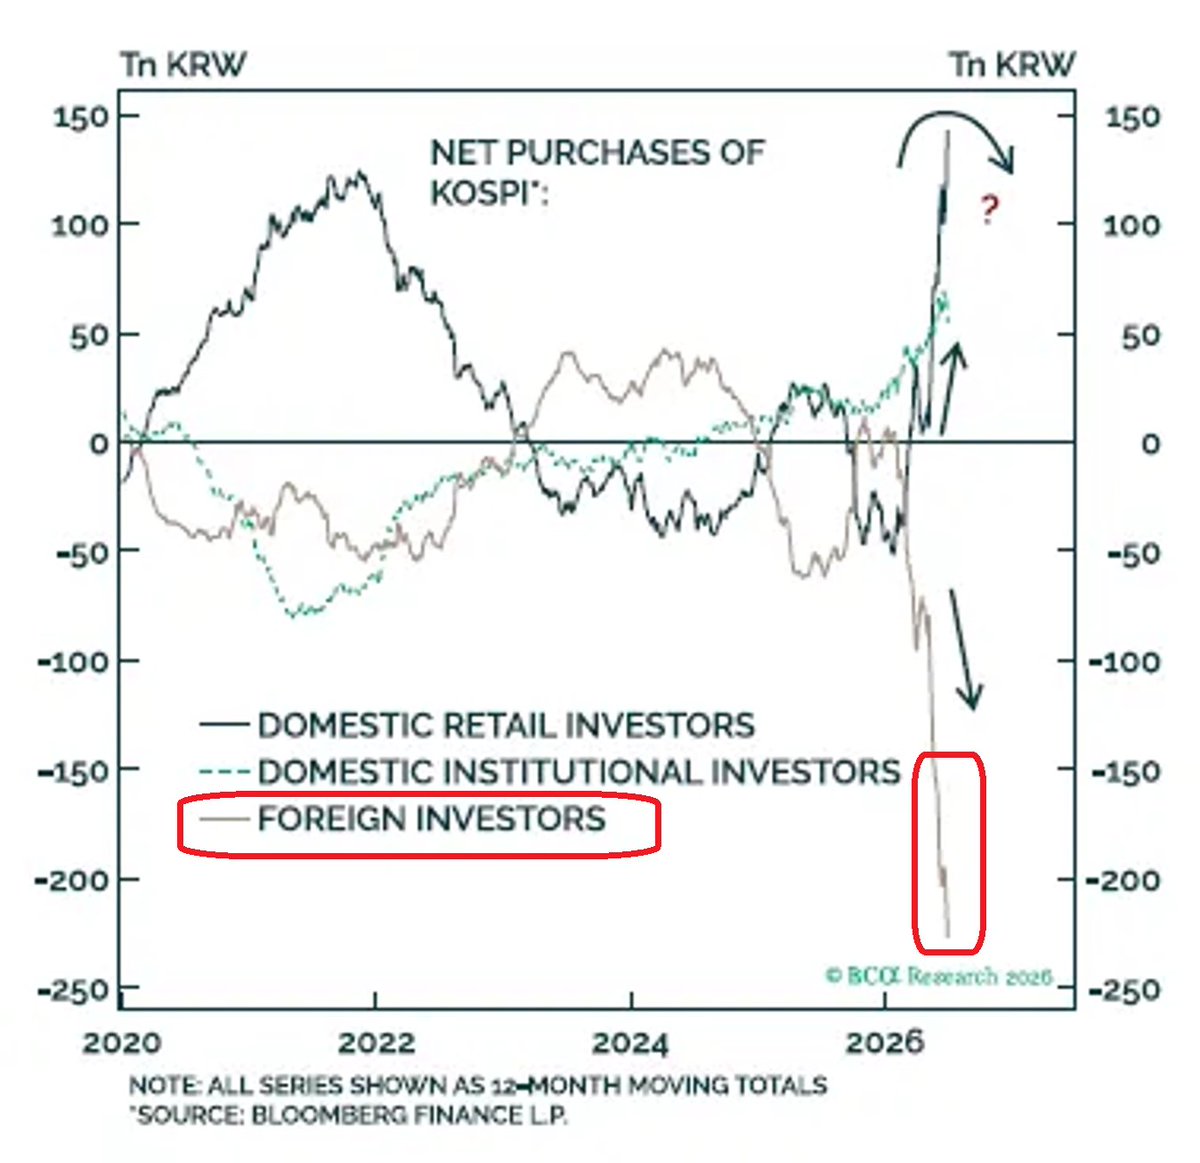
🔴Foreign investors are dumping Korean stocks at a RECORD pace.
In the past year, they sold off -230 trillion won (over -$140B). Just Wednesday alone saw -1.5 trillion won (-$938M) leaving — the 8th straight day of outflows.
Meanwhile, local retail and institutions bought