This has never happened before:
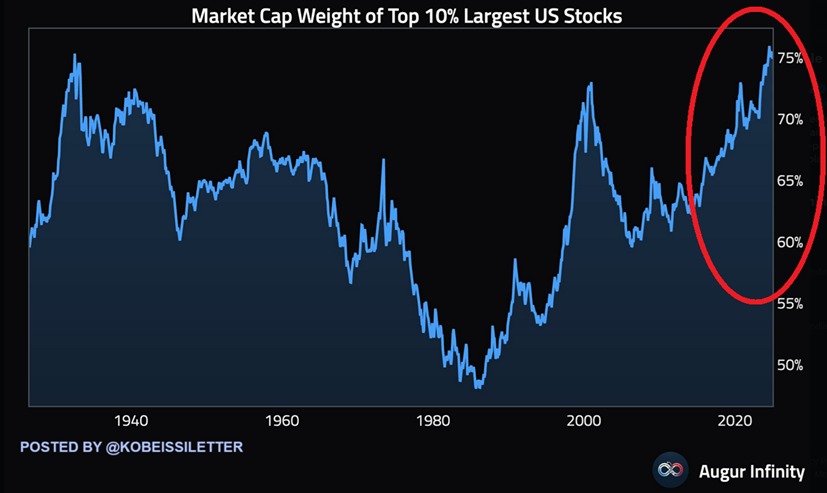
The top 10% largest US stocks now reflect a record 75% of the US equity market.
This percentage has surpassed the previous record set before the Great Depression in the 1930s.
By comparison, at the 2000 Dot-Com Bubble peak, this percentage was at 73%.
The top 10% of stocks as a % of total equity market cap has risen in a near straight-line since the 2008 bottom.
Furthermore, the top 10 stocks in the S&P 500 now reflect near a record 40% of the index.
The market has never been so concentrated.
At least in the tech bubble, companies trading at absurd valuations held a slim hope of eventually becoming profitable.
Fartcoin has zero intrinsic utility and is now being valued at $1.3 billion. This is the very definition of insanity in markets in my view.
Shocking stat of the day:
The top 10 stocks in the S&P 500 are now almost 800 TIMES larger than the 75th percentile stock.
Not even the Great Depression in the 1930s saw market concentration this high.
It's now 50% MORE concentrated than 2001.
1/ Quick update on market conditions.
Valuations have pushed to the most speculative extreme in U.S. history.
While valuations are informative about long-term and full-cycle outcomes, they are emphatically not useful indications of market outcomes over shorter horizons.
'On October 14, 2024, the U.S. equity market reached the most extreme level of valuation in history, based on the measures we find best-correlated with actual, subsequent 10-12 year returns across a century of market cycles.' https://t.co/l4BoIlvCM1 by @hussmanjp
'This seems like a completely contradictory message, expecting sharp rate cuts yet also continued strong earnings growth as these cuts would historically be consistent with a 20% or more decline in reported profits and so a 30%+ drop in forward earnings.' https://t.co/tiMGuSeXIB
Do not confuse VOLATILITY with RISK
RISK measures potential $ loss
VOLATILITY measures how much prices fluctuate (standard deviation of prices)
A few corollaries 👇
'The risk to investors is that stocks will again begin to move in the same direction, all at once. When that happens, some fear, the role of complex volatility trades could reverse and, rather than dampen the appearance of turbulence, exacerbate it.' https://t.co/G7I4hB9hUf
Over the past 32 trading days, NVDA has gained more than $1 trillion in market cap. To put that into some sort of perspective, the 6-week gain is greater than the total market cap of BRKA, which Warren Buffett has spent 6 decades in building.
According to Nomura’s data an army of volatility sellers grows monthly, now managing $200B in derivatives income funds. With over 250M vega supplied each month, they're suppressing volatility like never before 👇
Chicago PMI at 35.4 has been consistent with recession 100% of the time in the past. Those who threw in the towel on the call will be picking it up before too long, as they did in 1990, 2001 and 2008.
Credit spreads have only been as tight as they are today twice before – in 2000 and 2007. Bottom decile of all time. High-Yield priced for no defaults even though business bankruptcies have surged +35% in the past year to the highest level since 2020Q3.
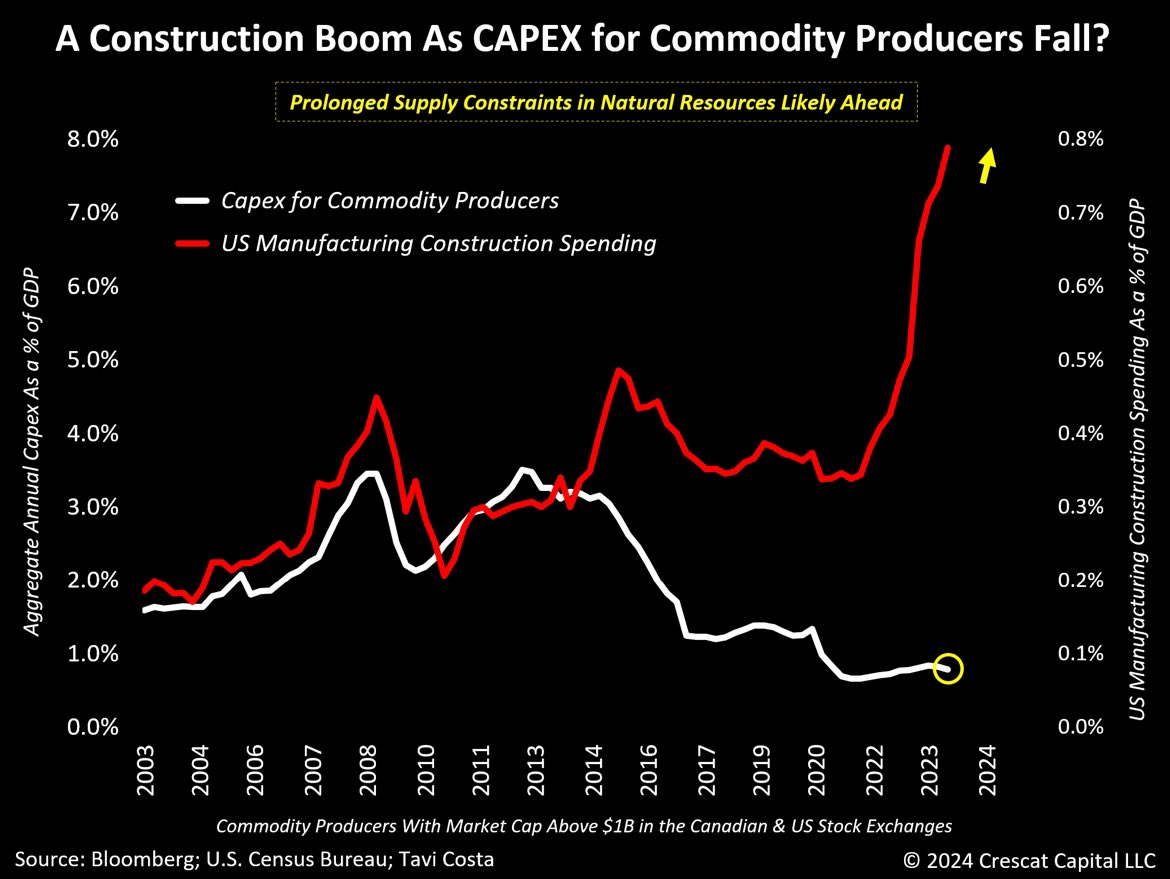
The chart below portrays a predicament that is progressively becoming the centerpiece of the demand argument for commodities.
Despite the recent upsurge in construction spending, commodity producers have evidently fallen short of matching this trend.
Capital expenditure in natural resource industries has remained near historically low levels, especially when adjusted for GDP.
It is important to bear in mind that changes in the supply curve of commodities typically align with the capital spending behavior of underlying producers, albeit with a significant lag effect.
Essentially, it requires time for investments to translate into increased supply.
The current scarcity of capex among these producers, juxtaposed with the upsurge in construction expenditure fueling material demand, ,in our analysis, portends significantly higher commodity prices to balance these markets in the face of these structural supply constraints.
Significantly higher prices, in our view, will be necessary to incentivize new capex investment, and it will take many years before these new supplies come on stream in a significant enough way to alleviate pricing conditions.
It has been taking a decade or more on average to bring a new discovery into production in today’s global anti-mining climate given the environmental and social licensing, government permitting, and capital-raising challenges.
This week marked a pivotal moment for silver as it confirmed one of its most significant technical breakouts in decades.
Notice how the trend started with gold, then silver and copper began to move, and now, in my view, it’s a matter of time for the miners to follow suit.
Few industries are as universally disliked as mining today.
In fact, to be blunt, very few people can put three sentences together about the mining space.
If metals continue to display resilience, which I expect they will, these companies could present some of the best distressed opportunities in recent memory.
The lack of capital interest and the scarcity of geologists and other workers entering the mining industry is setting the stage for one of the most supply-constrained environments in history.
From my perspective, this segment of the market is indeed one of the most inefficiently valued today.
But let us not forget:
In the money management industry, inefficiency is often a synonym for opportunity.