Trading is a game of chess
Veteran Financial Trader | MSc Finance
Creator of 'The Perfect Storm Index'™
Crypto • Elliott Wave
40+ years navigating market cycles
#SOL’s decline has been sharp, but my preferred interpretation is an ABC correction, with an extended wave C reaching approximately 2.618 times wave A near $101.
Bullish RSI divergence and the subsequent rebound support a potential low, although confirmation is still needed.
I’m watching for five waves higher, then a corrective pullback that holds above the low. That would strengthen the case for further upside.
Any staged accumulation on my part would stay within a predefined risk limit. Step by step.
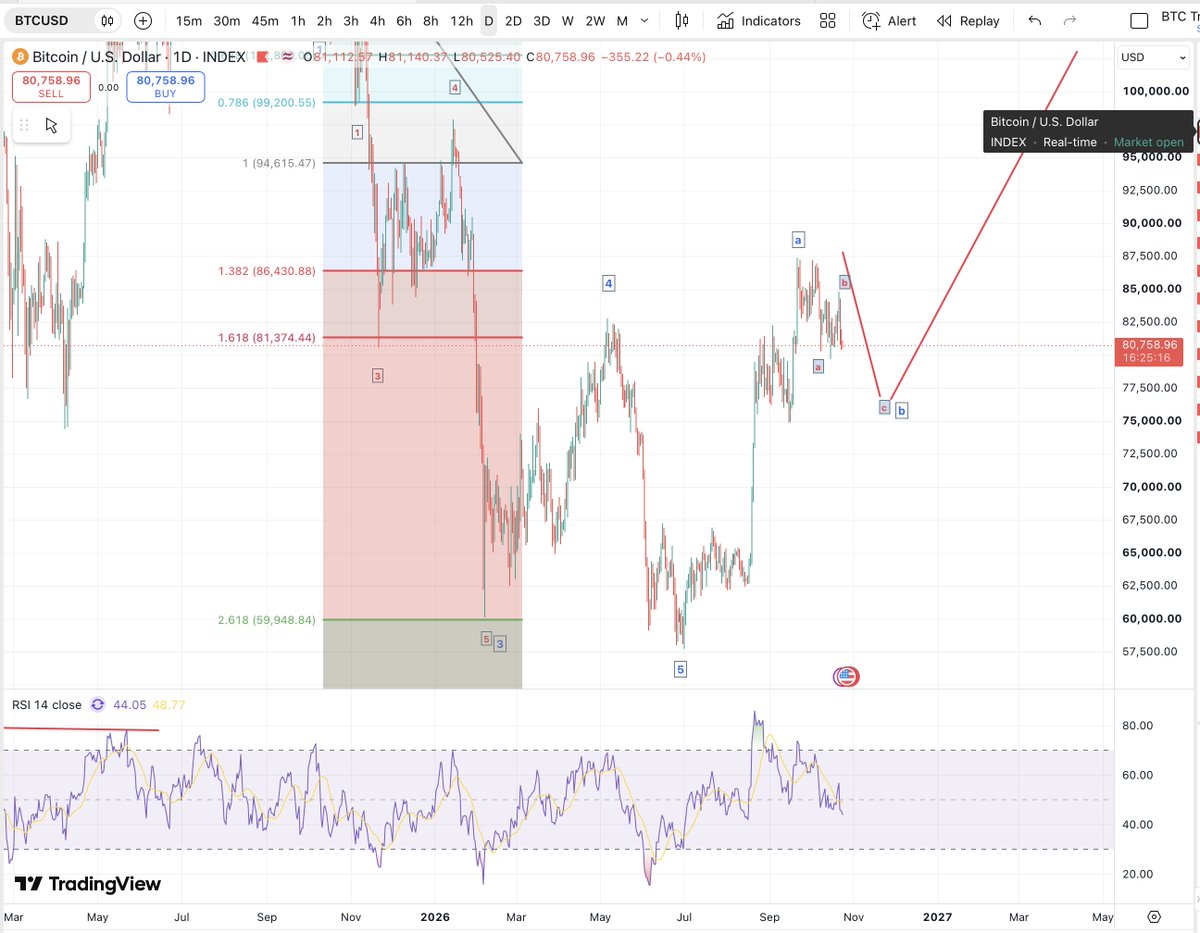
This is an extremely Bullish representation of the long term outlook for #BTC
Is there any constructive comment as to why this is right or wrong?
It looks good to me - except, im not happy that wave 3 is only 1.382 FIB X wave 1 (hence my earlier presentation that the whole $BTC move may be ABC)
Longer-term context matters, agreed. But reviewing valid alternative counts is essential to managing risk. I favour a primary count while tracking alternatives and their invalidation levels. Presenting an alternative doesn’t give it equal probability; it prepares us to adapt if the evidence changes.
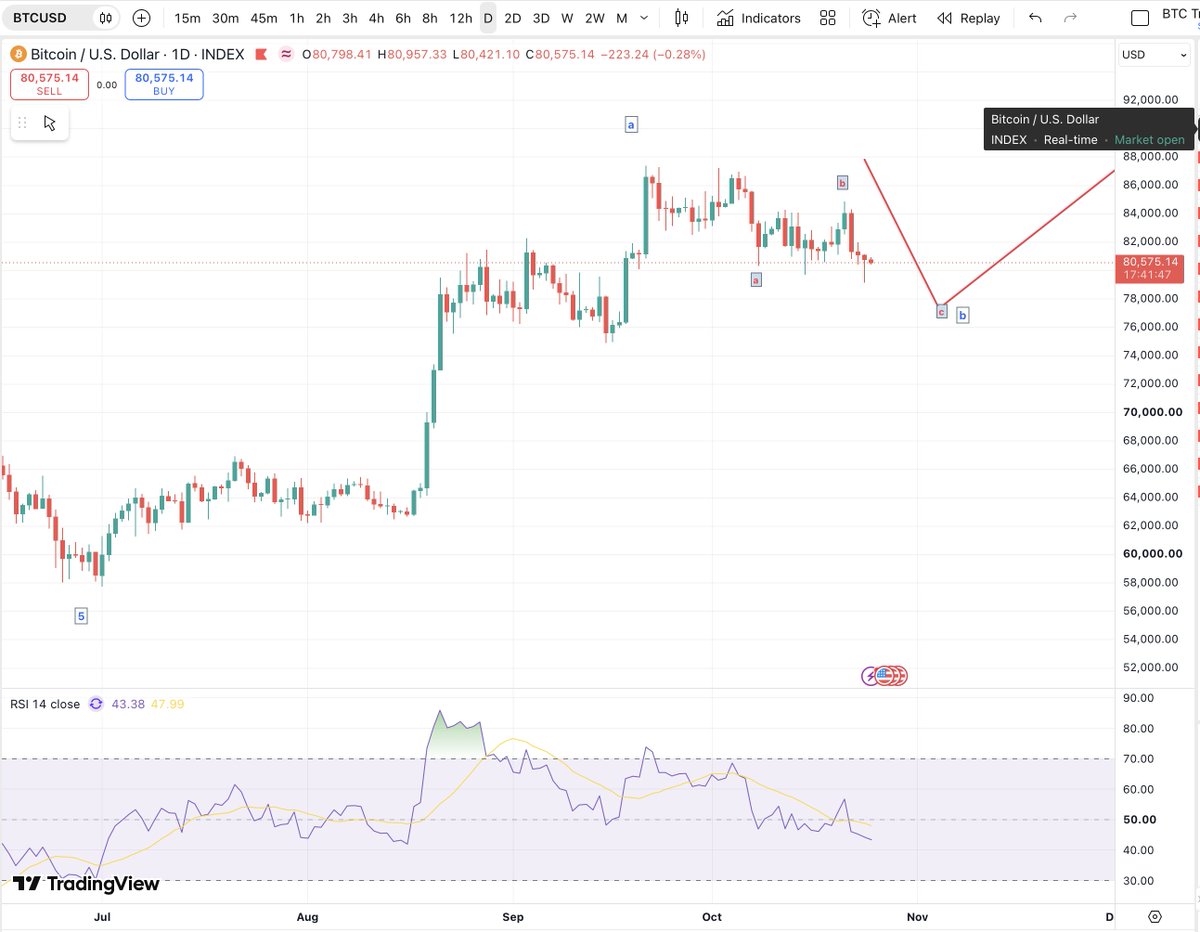
So far, #BTC is tracking the projected pullback. Two valid short-term counts remain in play, and both favour completion of this correction before another move higher.
Confirmation that the correction has ended is still needed. Step by step.
Fair questions, Phil. The dates on the projected path are illustrative; my confidence in timing is lower than in the potential structure. A depression isn’t inevitable because time has passed. Growth, liquidity and policy responses could materially change the outlook, so I’ll keep reassessing the count as price develops.
@joeokeefejr Thanks Joe. Agreed, daily RSI is showing weak momentum, which fits the b-wave pullback illustrated here. A break above that RSI trendline would add support for the subsequent c-wave rally. For now, it remains a conditional scenario requiring price confirmation.
Fair concerns, Jon. Bitcoin’s long-term case rests on scarcity, adoption and demand as a monetary asset. It pays no dividend, but neither does gold. ETF flows can reverse, so they’re no guarantee of higher prices. This count is a conditional scenario; future demand will determine whether it plays out.
@Mega_Pride_ru That rule applies to a contracting triangle. In a barrier triangle, D can marginally undercut B provided the B–D boundary remains essentially flat. Whether this undercut is small enough is the relevant question, hence presenting it as an alternative count.
Another alternative for #FET
If this is a completed barrier triangle, it implies the corrective recovery has already ended at E, with another downward leg underway. A break below D, approximately $0.12, would support that interpretation. A move above E, approximately $0.27, would invalidate the proposed completed-E count.
@GamefiAgent Which part do you disagree with, the wave count, the divergence or the projected path? This is a conditional scenario, and I’ll revise it if price invalidates it. A specific counterargument would make for a useful discussion.
Expectations often overshoot in both directions near market highs and lows. As traders, we need to guard against extrapolating the latest trend indefinitely.
Elliott Wave provides a framework for interpreting crowd behaviour, while Fibonacci levels help identify potential targets, not guaranteed turning points.
Divergences, as shown on this chart shows that Traders recognise this "overshooting" phenomenon and actually momentum fades at each ATH & ATL
Keep updating the count as the evidence changes.
Thanks, and have a lovely Sunday too. The projected path is a possible scenario, rather than a fixed forecast, the timing and depth remain uncertain.
Comparing BTC with the S&P 500 and gold would be useful. I’d normalise all three to the same starting point so their relative performance is clear.
@swadeep_c We did make a new low and so the blue b wave is conceivably complete, although I suspect it will likely go a little lower.
Im not trading these minute moves but im building the bigger picture for other potential trades at a larger scale
Expectations often overshoot in both directions near market highs and lows. As traders, we need to guard against extrapolating the latest trend indefinitely.
Elliott Wave provides a framework for interpreting crowd behaviour, while Fibonacci levels help identify potential targets, not guaranteed turning points.
Keep updating the count as the evidence changes.
#FET may have another leg lower before a potential C-wave rally completes the corrective recovery. A further decline could then follow in 2027.
That would fit my alternative scenario of a delayed #BTC low. For now, this remains a working count, with the triangle’s final leg still unconfirmed.
I’ve been asked about #ADA.
The shaded rebound looks corrective within the broader downtrend. Bearish RSI divergence also warned of weakening momentum ahead of the latest decline.
That keeps a retest of the low near $0.14 and potentially a break below it in play. A recovery above the rebound high near $0.28 would challenge this interpretation.
#Cardano
The low may be in, Chris, but we can’t know that with certainty. I see plausible alternatives and manage risk accordingly.
“This time is different” cuts both ways, it depends on which historical comparison we use. Halving cycles offer context, but a small sample cannot establish a fixed timetable for the next low.
I’ll keep updating my view as the evidence develops.
My projected #BTC low may arrive later than Q4, although a Q4 low remains possible.
The decline from the ATH appears countable as five waves: potentially wave A, wave 1, or C completing an expanded flat.
I currently favour A. Under that scenario, we’re working through a B-wave recovery, with a smaller pullback followed by another leg higher before a larger C-wave decline.
After that correction, I would look for a renewed advance towards new ATHs. A working scenario, subject to the evidence.