1/ Due to the FTX/Alameda situation $SOL has crashed over 50% in the past week and fears have risen that the price of SOLANA, as well as the Solana ecosystem, may never recover. Here is everything you need to know about the situation 👇🏻
Also, everything is available on the internet for free.
You can join the free Mentorship where we are learning to Trade Bitcoin.
It's organised, maybe slow but step by step to learn trading and all The tools.
JOIN - https://t.co/RnL7kX2m0B
Enjoy your day. All the best.
Bitcoin Trading Master-Class.
Mastering Trade Structure for trading 💯
- Clearing Doubts about Market Structure.
-How to identify entries and ignore fake structures.
-Answering your Questions.
Link- https://t.co/J4PPqkO9eM
Study it to Master Market Structure for LTF trading.
I Apologise to the people who charge $1000 to teach this.
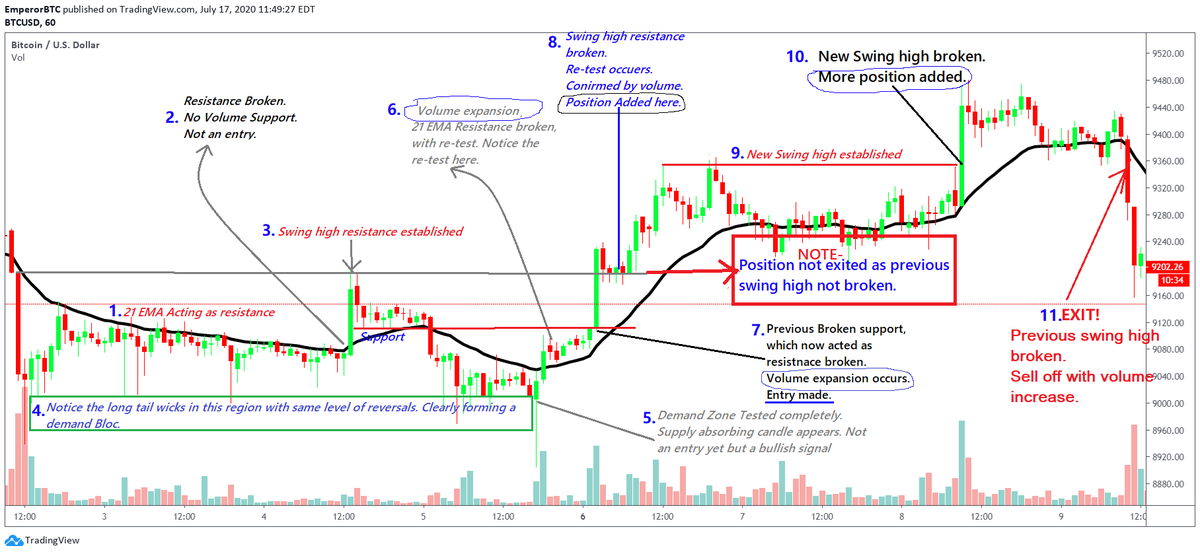
Explained in one chart:-
-Using EMA as Support/Resistance
-Addition to an open position
-Supply absorbing candle
-Swing high occurrence
-Volume Confirmation
-Supply Zone
Sharing it might really help someone.
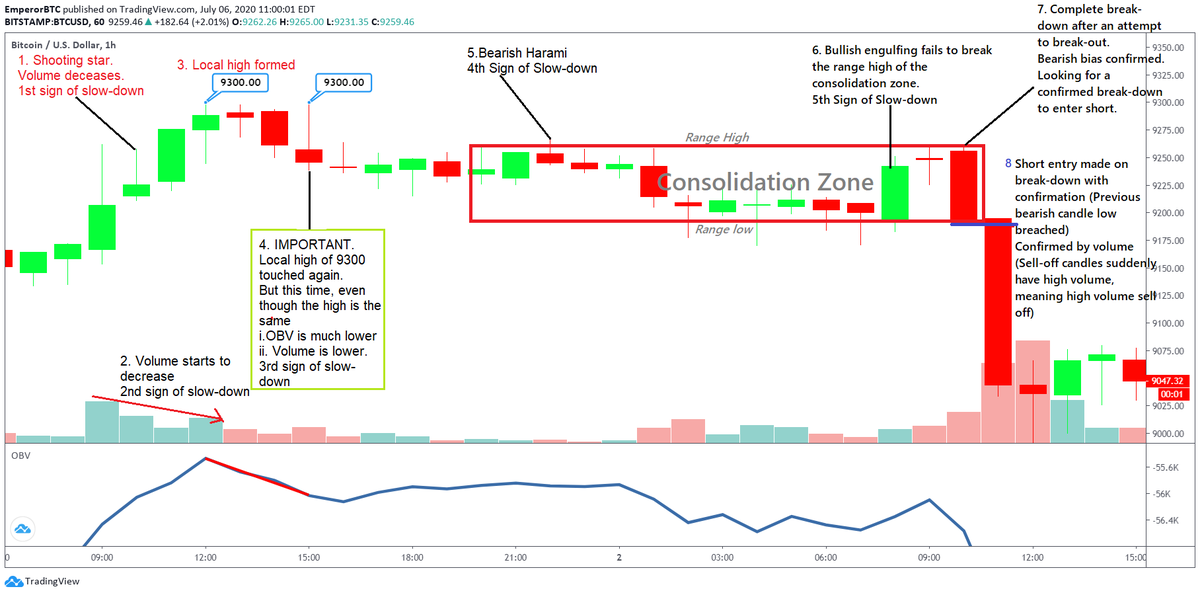
Explained in one chart- Using indicators to confirm Price movement.
Indicators are not entry signals but a statistical tool for comparison with the historical price.
Here, the lowering of OBV and Volume has been used to confirm a short entry along with Prime movements.
Hope you guys are doing great.
I'll be back in mid-August.
Writing THE BEST Technical analysis book for Trading Altcoins.
I will publish it in PDF format.
Will come back with a lot more.
Mum is getting better.
I truly miss you guys.
MASTER-CLASS on VOLUME for trading Bitcoin.
This is 1st module to the most comprehensive real-world guide to Volume Analysis.
Volume is a simple yet most powerful tool.
This is everything that you need to master it.
Please re-tweet so many more can see it and benefit.
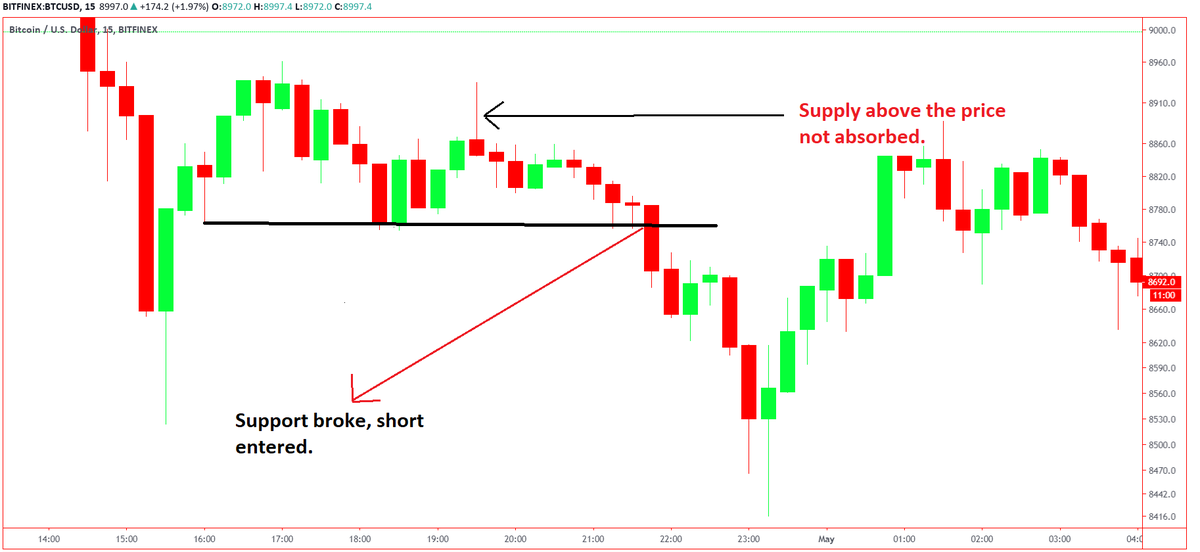
In a similar manner, on confirmation of a candle which failed to absorb the supply above, a safe short entry can be made.
1. Look for candle with long overhead wick.
2. Wait for previous supply to be broken.
See pic below for a short entry.
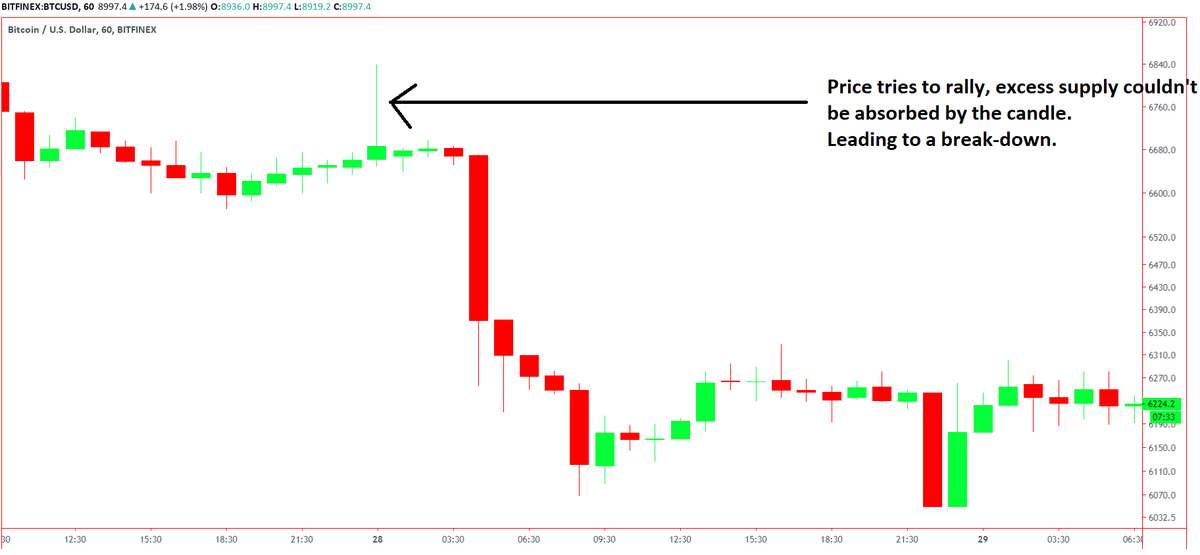
The same principle is applicable with candles with a long overhead wick.
This implies that the candle was not able to absorb all the supply above itself, which is generally bearish.
We should look for signs of reversal at this level.
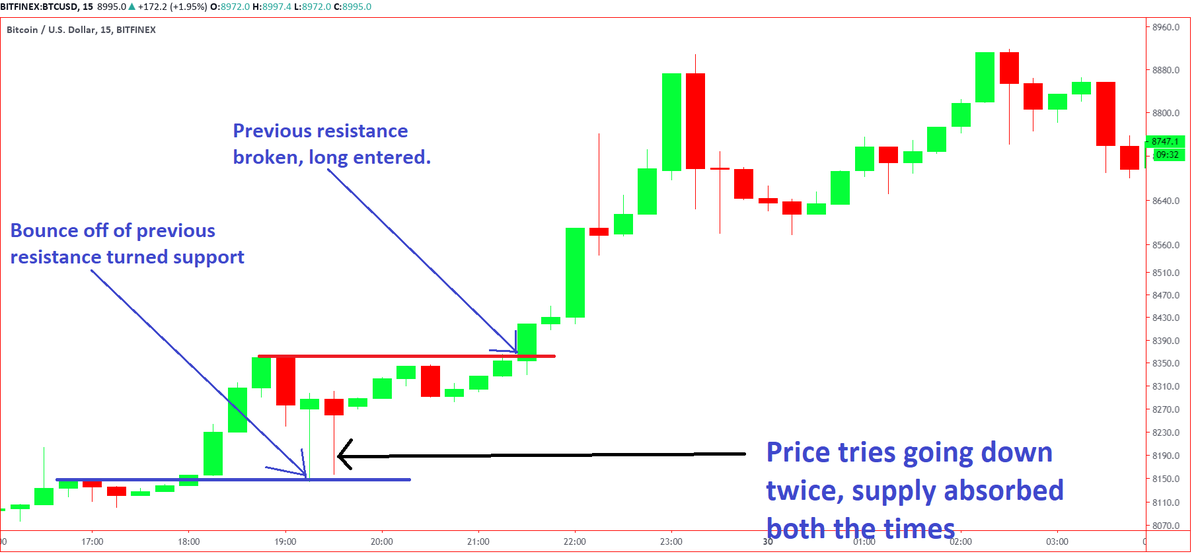
At this zone, traders could look for a safe long entry.
1. Look for candles with a long tail.
2. It should have bounced off of a previous resistance now turned support.
3. Wait for the price to break a resistance above.
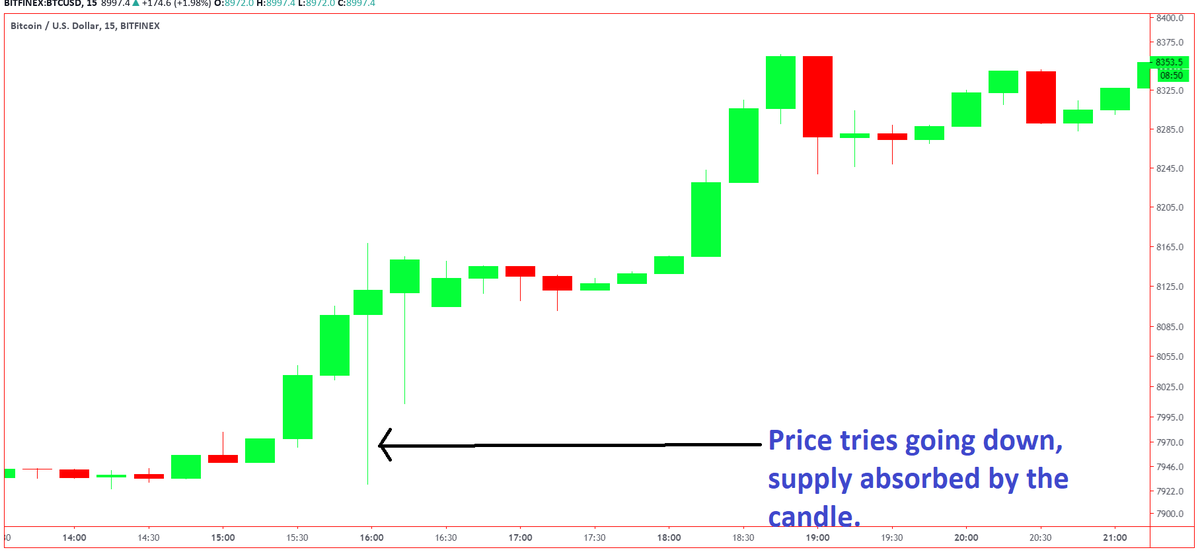
Candlesticks with a long tail wick, about 2-3 times their body have overcome a big supply zone.
This means that below that candle existed a huge supply order which was absorbed .
This is generally bullish, means the demand in that zone was able to overcome the supply.
See Pic
Finding SUPPLY and DEMAND pressure using candlesticks.
Candlesticks can be used to find supply and demand pressure, specially in intra-day trading.
I hope this changes how you view and use candlesticks on a daily basis.
A thread.
@MasalaOfCharts Hello Bombay, I have been following you for I while and I see that you are good. If you do not mind I will like to know more about you and have you in my WhatsApp please
“At the moment, education and communication are the only
weapons we have against HIV/AIDS”
The late Dr. Jonathan Mann, former Executive Director, World Health Organization / Global Programme on AIDS
The objective of United Nations are as follows :
1 . To take all necessary measures for establishing international peace
2. To eastablish friendly relations among the nations
3. To enhance international... https://t.co/tSkVvFFOvB