$NIO is bringing Geely into Nio Power, its battery-swapping and charging business.
Geely will invest about $95M in cash + contribute its battery-swap business for a 30% stake, valuing Nio Power at ~$2.4B.
Nio will retain 63.6%.
NIO and Geely reach battery swapping and charging cooperation agreement; Morgan Stanley reiterates its "overweight" rating with a target price of HK$68.5 (~$8.73)
$NIO
(FWIW)
$NIO is out of this world
I share many stocks;
Many Macro and Investment thesis...
But none of them makes me think as much as $NIO and still be confused.
The thesis is just immaculate. Only downside is being Chinese.
A company making $16B in Revenue with $8B MC.
With $8B in short term assets... (just $1B is investory).
Growing 50%+ a year
And still trading at lows...
This chart is actually very interesting for $NIO, but it measures something completely different from the first chart.
What it’s showing
The chart takes each company’s GAAP net income/loss and divides it by the number of vehicles delivered.
So for Q2 2026:
NIO: -$78M net loss ÷ 107,658 vehicles = -$723 per vehicle
XPeng: -$197M ÷ 103,295 = -$1,907 per vehicle
Li Auto: -$251M ÷ 98,330 = -$2,556 per vehicle
In other words, NIO lost only about $723 for every vehicle delivered at the company-wide net-income level.
The really important part
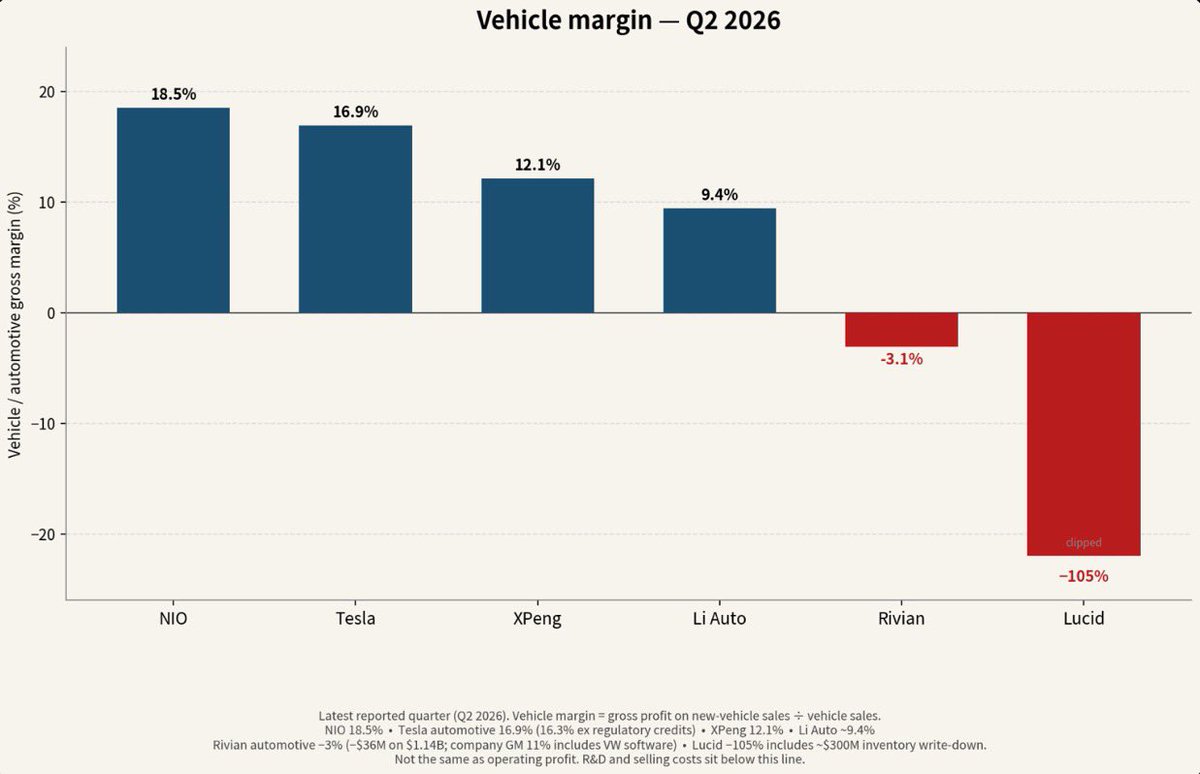
Compare this with your previous chart:
NIO vehicle gross margin: +18.5%
So NIO is making substantial gross profit on each vehicle, but after R&D, selling/general/administrative expenses, other operating expenses, etc., the company still ended Q2 with a relatively small net loss.
That’s a very different situation from NIO several years ago.
Look at the progression:
NIO net loss per vehicle:
2020: -$19,700
2021: -$18,100
2022: -$17,200
2023: -$18,600
2024: -$14,000
2025: -$6,800
Q2 2026: -$723
That’s an enormous improvement.
NIO has gone from losing roughly $18,000 per vehicle to losing less than $1,000 per vehicle.
And this is where your thesis gets interesting
The first chart says:
NIO vehicle economics → 18.5% gross margin
This chart says:
NIO company economics → only $723 net loss per vehicle
Those two things together suggest NIO is very close to crossing the net-profitability threshold.
If NIO’s margins remain around 18–20% and volume continues increasing, there are two ways to get from -$78M quarterly net income to positive net income:
Increase vehicle volume while keeping fixed costs relatively controlled.
Increase gross profit per vehicle.
And NIO potentially gets both.
For example, if NIO delivers ~120,000 vehicles in a quarter and gets to $1,000+ net profit per vehicle, that’s roughly $120M quarterly net profit.
At 130,000 vehicles and $1,500 net profit/vehicle, that’s about $195M quarterly profit.
One very important warning
Don’t interpret the -$723 as saying NIO’s cars are losing $723 each.
They’re not.
The chart explicitly says “Company net, not vehicle margin.”
The cars are generating positive gross profit. The $723 is the company’s total net loss allocated across its deliveries.
That’s why I actually think this chart complements your first chart extremely well.
Chart #1: NIO’s vehicle-level economics are already excellent.
Chart #2: NIO’s company-wide profitability is rapidly approaching breakeven.
And that’s arguably the most important transition for the NIO story: the gap between strong vehicle economics and actual net profitability is getting very small.
Valneva Announces Lifting of European Medicines Agency’s Temporary Restriction on Use of Chikungunya Vaccine IXCHIQ® in Elderly.
https://t.co/2ZLONMncTT
Valneva Reports Positive Six-Month Antibody Persistence and Safety Phase 2 Results in Children for its Single-Shot Chikungunya Vaccine IXCHIQ®.
https://t.co/dtKxhxwCSO