Worried About the Market? Read This First
Most traders don’t need more panic.
They need more understanding.
I took the paywall down on one of my best-performing posts because I’m seeing a lot of worried traders and investors right now.
And honestly, this is exactly why I wrote it.
Most people think market crashes come out of nowhere. They don’t.
The market usually gives warning signs before major tops, and it usually gives confirmation when a new bull market is beginning. Once you learn how to read market structure, the market becomes a lot less emotional.
You stop reacting to every headline.
You stop getting shaken out by every red day.
You stop guessing.
This post breaks down how to recognize major changes in market character using principles from Stan Weinstein, and William O’Neil.
It has been one of my most-read posts for a reason.
If you’ve been feeling worried about the market, start here.
https://t.co/ggJHwWsfp9
The Nasdaq Fired a Warning Shot. Read This Before Planning Trades.
Before screening or planning trades this week, step back and zoom out.
Read the big picture first.
Friday was not a normal pullback. The Nasdaq-100 dropped 4.77%, the S&P 500 fell 2.64%, volatility spiked, breadth weakened, and leadership shifted defensively.
That is a warning shot that should not be ignored.
The Stage 2 uptrend is still intact, but this is no longer a maximum-aggression environment. When the market changes character, your process has to adjust with it.
The goal is not to predict whether Friday was a one-day outlier or the start of a deeper correction. The goal is to manage risk, protect capital, and let the market confirm the next move.
Stock selection and industry group strength matters, but the general market is still the tide that lifts or lowers most boats.
This week’s Big Picture Market Pulse breaks down the major indexes, volatility, breadth, distribution, relative strength, sector rotation, the Composite Model, and updated exposure levels.
Nervous About a Trade? Your Position Is Too Big.
If you've done your homework, the stock has the characteristics of past market leaders, and it fits your process, but you're still nervous before entering the trade, the answer is usually simple:
Get smaller.
For one trader, that might mean a $100 position. For another, it might mean $1,000, $10,000, or $100,000.
The dollar amount does not matter. What matters is risking an appropriate amount based on your system and your own ability to follow the plan without fear taking over.
Say your system allows you to risk 1% to 2.5% of your total portfolio on a trade, but you still feel pressure, fear, or hesitation. Drop the risk until that feeling goes away.
Maybe that means risking 0.25% of total equity. Maybe it means even less.
That is fine.
If you're constantly checking the position, losing sleep, or second-guessing every tick, your size is too large for your current comfort level.
Reduce it until you're completely comfortable.
Trading is psychological. The right position size is different for every person. Over time, as your confidence and experience grow, your size can grow too.
But the solution to fear is rarely more courage.
It's usually smaller size.
Watch Me Screen for the Market’s Strongest Stocks
In this video, I walk through the same screening process I covered in the recent article, How I Find the Biggest Winning Stocks in the Market, but this time I show it inside the Momentum Trading Strategy Web App.
The goal is simple: narrow thousands of stocks down to the names showing the strongest leadership characteristics.
I cover how I use the Relative Strength Stock Screener to find leaders, including:
The basic CANSLIM-style leadership screen
Big earnings and sales growth
Relative strength rankings
Big gap-ups and biggest movers
Trend template filters
New 52-week highs
Industry group leadership
The MTS Score
How names move from the scanner to the watchlist
I also show why high relative strength does not automatically mean you missed the move. Many of the biggest winners I shared earlier this year already had 98 or 99 RS Ratings before they continued +100% higher.
For context, here are a few examples of names shared earlier this year and their performance since first being mentioned:
AAOI +299%
AXTI +284%
SNDK +264%
DELL +184%
MU +172%
CIEN +170%
LITE +164%
STRL +157%
WDC +144%
STX +131%
SIMO +125%
VIAV +114%
AMD +114%
INTC +107%
ALAB +106%
The point is not that every stock will work or that every move will be captured perfectly. The point is that the same screening process has repeatedly surfaced stocks that went on to become some of the strongest leaders in the market.
Watch the video, and if you have any questions, let me know.
I also reference the Momentum Trading Strategy Course throughout the video. Module 4 covers the leadership characteristics in more detail, along with other modules that build out the full process. You can access the course here:
https://t.co/QEte2K8IJC
FIX: A CANSLIM Model Stock?
Looks like $FIX is finding support at the 10-week moving average and may be gearing up for another run at new highs.
Most traders only see the move since April 2025. Zoom out and you'll see a stock that's been in a steady uptrend since coming off the 2020 lows.
The fundamentals match the chart:
✅ Big earnings growth
✅ Strong sales growth
✅ High ROE
✅ Healthy margins
✅ 95 Relative Strength Rating (1-year)
✅ EPS has grown at least 25% in each of the last three years.
This is what a CANSLIM-style leader looks like. Strong fundamentals, strong relative strength, and institutional demand showing up in the price action. The fuel behind the chart.
Put MU in the Model Book
Big earnings. Big sales. Big ROE. Big margins.
MU checks nearly every box that has defined many of the market's biggest winners.
• EPS Growth: +756%
• Sales Growth: +196%
• ROE: 39.8%
• Pretax Margin: 67.7%
• Relative Strength: 98–99 across multiple timeframes
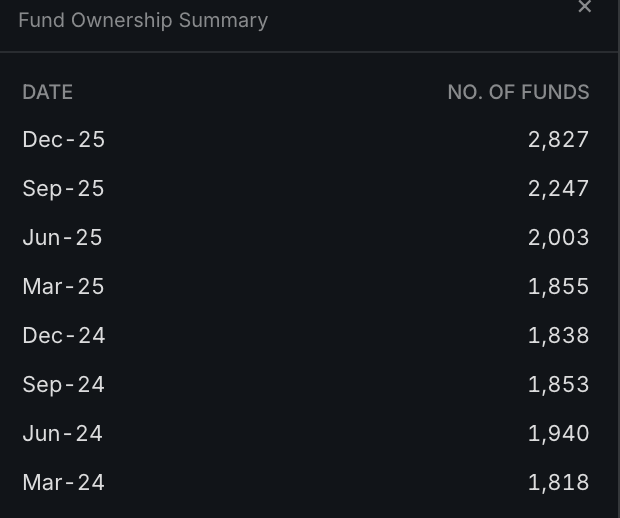
• Fund Ownership: Increasing quarter after quarter
This is what institutional accumulation looks like.
Strong fundamentals. Strong sponsorship. Strong price action.
$MU
The Multi-Bagger Irony
A lot of stock newsletters sell people on the hope of finding the next multi-bagger.
A 100%, 200%, or 300% winner.
Many talk about holding for years to get the big returns.
What people don't realize is this:
By the time you figure out they were full of it, they already made plenty of money selling you the hope.
The funny thing is, I don't even teach or claim to give people multi-baggers.
But many investors would likely get similar or better results by learning how to identify true growth stock leadership, proper setups, institutional demand, and strong price action.
Here are a few names I mentioned in January and early February on my Substack:
• AAOI +302%
• AXTI +294%
• SNDK +249%
• DELL +214%
• MU +160%
• LITE +155%
• CIEN +147%
• STRL +127%
• STX +126%
• WDC +124%
• INTC +101%
• AMD +101%
These were discussed in the paid subscriber chat and watchlist posts.
But to be clear, this is not what I do here.
I'm not telling you to blindly buy a stock and hold it until it becomes a multi-bagger.
The goal is to teach you how to find leadership, manage risk, identify proper entries, and build a repeatable process.
Are You Missing Stocks by Only Looking for Strength?
I got a good question from a subscriber, and I think many newer traders have probably wondered the same thing.
"If I filter for an MTS Score 80+ (similar to the IBD Composite Rating), am I missing stocks that are just starting to improve from lower levels?"
Yes, that assumption makes sense.
But this is also where growth stock investing and momentum trading can feel counterintuitive.
If you filter for an MTS Score above 80, you may miss some stocks that are just beginning to improve from lower levels.
However, the purpose of that filter is not to find stocks at the bottom.
The goal is to find stocks that have already started proving themselves as leaders.
William O'Neil's research, along with the work of many great growth stock and momentum traders, shows that the biggest winning stocks often display strength before their biggest moves.
They typically already have:
• Strong relative strength
• Big earnings and sales growth
• Strong margins or ROE
• Improving institutional sponsorship
• Leadership within a strong industry group
• Price action near new highs
All before the majority of the move occurs.
Conventional wisdom makes people want to find stocks early at the bottom or near the bottom.
But growth stock investors are usually looking for confirmation that a stock is becoming a true leader.
Many of the stocks that have gone up 100%, 200%, or more over the past few months already had strong ratings above 80 before the majority of the move happened.
$CIEN is a good example.
When I first mentioned CIEN back in January, it already had strong ratings and a Relative Strength Rating of 98.
Many people would assume that means they “missed it.”
But from that point, the stock still went up more than 125%.
Strength often comes before more strength.
So yes, a lower MTS Score filter can help you cast a wider net for earlier improvement.
But an MTS Score above 80 is designed to focus on strength, leadership, and confirmation.
We are not trying to buy the weakest stocks before they turn.
We are trying to find the strongest stocks as they prove they are leaders.
The MTS Score is a proprietary leadership rating that evaluates factors such as Relative Strength, EPS growth, Sales growth, ROE, Margins, Industry Group Relative Strength, and other characteristics commonly found in leading stocks.
Technology Continues to Dominate
Looking across the 11 major U.S. sectors, one thing remains remarkably clear: technology continues to lead by a wide margin.
Since the April follow-through, no other sector has come close to matching the performance of $XLK . The relative strength advantage has been obvious and consistent every week we've reviewed the data. Leadership continues to be concentrated in technology and the growth-oriented industry groups.
As traders, our job is not to argue with leadership. Our job is to identify where capital is flowing and align ourselves accordingly. The evidence has been remarkably clear. If you have been fighting this leadership or searching for strength in weaker areas of the market, perhaps this should be your wake-up call.
Most traders are drowning in tickers.
That is why I built the Relative Strength Stock Screener.
It screens thousands of stocks, ranks leadership across multiple timeframes, filters for the strongest names, and helps you build focused watchlists around real market leaders.
No more guessing.
No more random stock chasing.
Find the strongest stocks, in the strongest groups, with a repeatable process.
Most Traders Don’t Have a Strategy Problem
Most traders think they need a better setup.
A better indicator.
A better stock pick.
But usually, that is not the real problem.
The real problem is that they are weak in one of the three pillars:
Risk management.
Mental discipline.
Strategy & Tactics.
You can have a great setup and still lose if your risk is too big.
You can understand risk and still fail if you cannot follow your rules under pressure.
You can be mentally tough and still struggle if you do not have a strategy with positive expectancy.
Successful trading is not built on one thing.
It is built on all three working together.
That is how you move from random results to consistent profitability.
VSH: Price Is King
$VSH is one of those names that has been showing up on my relative strength screener.
I have not participated in it.
I have mostly just watched it go higher.
But when you look at the last three quarters, it is easy to understand why the stock has been moving.
Earnings have accelerated.
Sales have accelerated.
It is in a hot industry group.
And the estimates over the next few quarters are large.
That said, it is not perfect.
Pre-tax margins and ROE are not great, and fund ownership has been relatively flat quarter over quarter.
But price is king.
And VSH has been a huge winner for the traders who participated in it.
This is another reminder that the relative strength screener is not there to tell me what I already believe.
It is there to show me what the market is actually rewarding. Simple but powerful tool.
MU Breaks Out Again
I’ve been talking about MU since January.
And now we have another breakout to new highs.
Why have I liked MU?
Same thing I keep saying over and over again.
Big earnings.
Big sales.
Amazing return on equity.
Strong margins.
A hot industry group.
One of the strongest stocks in that group.
Aligned with the current bull market theme.
Fund ownership also continues to increase quarter over quarter.
Yes, there have been higher-performing relative strength stocks on a pure price basis.
But when you combine fundamentals and price action, there are not many names that come close to MU.
This is not about chasing random names.
It is about identifying super performance characteristics, tracking the leaders, and staying aligned with the strongest stocks in the strongest groups as long as the evidence remains intact.
MU continues to check those boxes.
Stock Screening: The Same Names Keep Showing Up
There is no surprise here.
Most of the names I liked in my weekend scanning are the same names we have been talking about for months.
The best stocks usually keep showing up.
STX is one of them.
It is moving back toward new highs, and it still has a lot of the characteristics I want to see:
Strong earnings growth.
Strong sales growth.
High relative strength.
Strong ROE and margins.
Increasing fund ownership.
A strong industry group.
Price action aligned with the current bull market theme.
This is not about finding something obscure.
It is about finding strength, tracking it, and staying aligned with it as long as the evidence remains intact.
Eventually, every trend ends. The setups will stop working, the leaders will break down, and the market will rotate somewhere else.
But if you have been doing this correctly, by the time that happens, the gains from the trend should more than offset the normal losses that come when the move finally ends.
That is the whole point of following leadership.
You are not trying to be right forever.
You are trying to stay aligned while the evidence is there, and then get out when the evidence changes.
Are You Sick of Me Posting About AXTI Yet?
AXTI is back at all-time highs.
Are you sick of me posting about this stock yet?
Good.
Because this is the whole point of relative strength.
The strongest stocks usually keep showing up before everyone wants to believe them. They keep appearing on the screens. They keep building higher. They keep forcing you to either pay attention or make excuses.
That does not mean you chase.
That does not mean you FOMO into the trade.
And it definitely does not mean the stock can’t pull back or that the trend will last forever.
But when a stock keeps showing up with strong price action, strong relative strength, strong earnings and sales, and strength from a leading industry group, it deserves to stay on the radar.
This is where a lot of traders make the mistake.
They miss the first entry, take it off the watchlist, and never come back.
Or the stock pulls back, and they assume the move is over.
But leading stocks can trend for months.
AXTI has been doing exactly that.
So the better question is not, “Did I miss it?”
The better question is:
Is the trend still intact, and is the stock still acting like a leader?
“The trend is your friend except at the end when it bends.” — Ed Seykota
And right now, AXTI still hasn’t bent.
Look at $MRVL .
This is what leadership looks like.
The stock has been showing a great deal of relative strength. Over the last week, it has held up extremely well and continues to trade near highs.
Fundamentally, it checks a lot of the boxes we want to see: strong earnings growth, good sales growth, good ROE, solid pre-tax margins, and it belongs to a strong industry group.
The relative strength is also very strong across multiple time frames, and it has been consistently outperforming.
“The institutional buyers are by far the largest source of demand for stocks. Leading stocks usually have institutional backing.”
- William O’Neil
That's why i track it in the https://t.co/UBXsta0pZE
Stop Chasing Stocks. Start Mastering the Real Game.
I’m amazed at how much effort people put into trying to find the next big stock, while ignoring the things that actually determine whether they survive long enough to compound capital:
Risk management.
Position sizing.
Trade management.
A disciplined process.
$FIX is a great example.
This is not some random name that suddenly showed up on a screen. I’ve talked about FIX for a long time and have been watching it since 2022.
Why?
Because it checks many of the same boxes William O’Neil wrote about when studying the greatest winning stocks in market history.
Consistently strong relative strength. 90+
Massive quarterly earnings growth.
Massive quarterly sales growth.
Annual earnings growth of 25% or greater over the last three years.
Strong return on equity.
Strong margins.
Increasing fund ownership quarter after quarter.
At some point, what else are you looking for in a leading stock?
The problem for most traders is not that there are no good stocks.
The problem is usually one of three things:
They are looking at and trading the wrong stocks, instead of focusing on the right characteristics.
They lack discipline, risk management, and position sizing skills.
They have no clue how to manage the trade once they are in.
Or they do not have a real system or strategy.
Everyone says they want stocks.
But when strong names show up, many people still do not execute.
And the ones who do execute often do not know how to manage the trade once they are in it.
That is exactly why I decided to put so much work into the Momentum Trading Strategy Course.
Because finding the next big stock is only a small part of success in this game.
Real lasting success comes from knowing what to look for, when to act, how much to risk, and how to manage the position after entry.
Stocks matter.
Process matters more.