Iran's President FULL INTERVIEW With Al Jazeera SUBBED and Chaptered
President Masoud Pezeshkian speaks in New York on negotiations with the U.S., the Strait of Hormuz, Trump, Israel, regional security and Iran's future.
CHAPTERS:
01:42 - Iran's Message To The World
03:37 - U.S. Negotiations And Loss Of Trust
05:32 - Strait Of Hormuz Agreement
08:47 - Would Pezeshkian Meet Trump?
11:12 - Iran's Conditions For A Deal
14:24 - Netanyahu And Regime Change
17:42 - Why Iran Targets U.S. Bases
19:29 - Saudi Arabia, Yemen And Muslim Unity
22:59 - Qatar's Regional Security Proposal
25:42 - Hezbollah And Iran-Backed Groups
28:41 - Iran's Economy Under War And Sanctions
31:04 - China And Russia
32:05 - Supreme Leader's Health And Leadership
35:47 - "Iran Will Not Fall"
41:22 - Iran's Relationship With The New Syria
@ericmwhite@drpezeshkian And don´t forget that the mou includes peac on all fronts including lebanon, your partner Isreal, attacked Lebanon on the first day of the MOU.
The US startet this war togehter with Isreal and you are loosing.... accept it, the US has to surrender for peace!
@ericmwhite@drpezeshkian Second point of the MOU:
"The United States of America and the Islamic Republic of Iran undertake to respect each other’s sovereignty and territorial integrity and to refrain from interfering in each other’s internal affairs."
The strait of Hormuz is not part of the US, is it ?
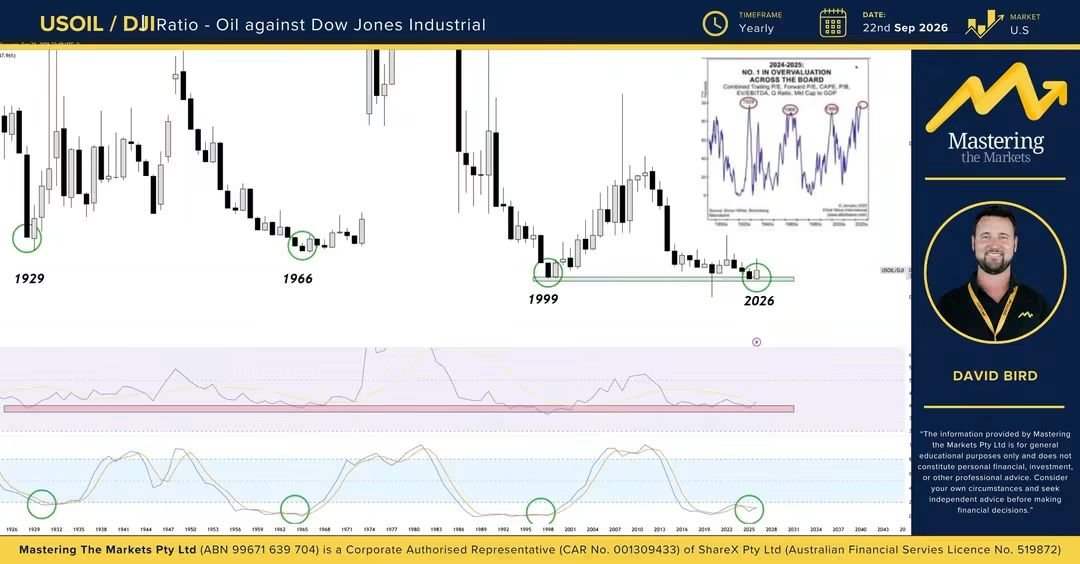
THIS CHART GOES BACK 100 YEARS… AND WE’VE ONLY BEEN HERE THREE TIMES BEFORE.
This is Oil vs the Dow Jones Industrial Average on yearly candles.
Basically, when this chart is this low, oil is historically cheap relative to US equities.
Now look at the previous major lows:
1929.
1966.
1999.
And now… 2026.
Those dates aren't exactly random.
Each of the previous periods occurred around major turning points for US equities and was followed by a very difficult long-term period for stocks, alongside major rotations between asset classes. Equties had dead money for over a decade.
Now look at the technicals.
The yearly RSI is sitting around 40, an area that has historically acted as support for this ratio.
Then look at Stochastic RSI.
The previous major oversold extremes on this chart occurred around 1929, 1966 and 1999.
And now we're back there again.
But here's where things get really interesting.
Look at the small chart I've added in the top right.
That's the fundamental side of the equation.
It combines a range of US equity valuation measures including trailing P/E, forward P/E, CAPE, price-to-book, EV/EBITDA, Tobin's Q and market cap-to-GDP.
And what periods jump out as major valuation extremes?
1929.
1966.
1999.
And the current period.
So we've got two completely different ways of looking at the market telling a very similar story.
The technical chart is telling us energy is historically cheap relative to equities.
The fundamental data is telling us US equities are historically expensive.
Coincidence?
Maybe.
But this is exactly why I love combining technicals, fundamentals and macro rather than looking at any one thing in isolation.
Does this mean US equities crash tomorrow?
No.
Does it mean oil goes straight up from here?
No.
This is a big-picture macro chart. I'm not looking at what happens next week. I'm looking at where capital could rotate over the next 5 to 10 years.
And when I keep seeing the same message across oil, commodities, bonds, valuations and relative-strength charts like this, I'm paying attention.
It's also one of the major reasons I'm personally very cautious about US equities at these valuations and far more interested in the opportunities developing across energy and commodities.
1929. 1966. 1999. 2026.
History doesn't have to repeat.
But when everything aligns it's rarely coincidence!
@Bitcoin_Dani in jedem deiner tweets geht es um jemand anderen... Jedes mal. Es reicht doch irgendwann. Du bist doch locker 40 oder so. Ist dir dieser Gossip nicht etwas peinlich.
Vorsicht. Jetzt rufen sogar die Bitcoin-Bären den Bullenmarkt aus.
Also dieselben Leute, die monatelang nach tieferen Tiefs gerufen haben. Der Grund für sie, dass jetzt der Bullenmarkt bestätigt ist: Bitcoin hat das Hoch vom Mai rausgenommen und steht über 85.000 US-Dollar.
Dieser Ansatz ist aus meiner Sicht absolut gefährlich und mit diesen einfachen Bedingungen werden viele wieder Geld verbrennen.
Für mich ist deshalb nicht die entscheidende Frage welchen Level wir überschreiten. Mich interessiert: Wie läuft die nächste Korrektur ab?
Denn sie wird kommen. Bitcoin marschiert nicht nur nach oben, irgendwann gibt es Gewinnmitnahmen. Wann und von welchem Niveau aus, ist zweitrangig. Entscheidend ist die Struktur.
Die wichtigste Marke für mich bleibt die Short-Term-Holder Cost Basis. Das ist der durchschnittliche Einstandskurs der kurzfristigen Investoren, also der Bitcoin-Touristen. Aktuell liegt sie bei gut 71.700 US-Dollar.
Diese Linie wandert mit. Es ist eine On-Chain-Metrik, sie wird aus echten Transaktionen berechnet. Je länger wir darüber bleiben und je mehr zu höheren Preisen gekauft wird, desto höher steigt sie. In ein paar Wochen wird sie deutlich höher liegen.
Schaut euch den Chart an. Anfang 2023, am Ende des letzten Bärenmarkts: Bitcoin holt sich die Cost Basis zurück. Die Korrekturen danach setzen genau dort auf und halten. Genau dieses Verhalten sehen wir historisch immer wieder, wenn ein Bärenmarkt wirklich vorbei ist.
Und wenn die Linie bricht? Dann liegen die kurzfristigen Investoren im Minus. Viele bekommen Panik, verkaufen mit Verlust und drücken den Kurs noch weiter nach unten. So entstehen Fake-Outs, also Ausbrüche, die sich im Nachhinein als Falle entpuppen.
Wenn die Korrektur kommt, stelle ich mir drei Fragen:
1. Wer kauft den Rücksetzer? Sehen wir echte Spot-Nachfrage, also Käufe von echten Bitcoin ohne Hebel?
2. Was zeigen die Orderflow Daten? Also: Wer kauft oder verkauft aggressiv zum Marktpreis?
3. Ist die Bewegung von Futures getrieben oder von Spot-Verkäufen? Spot-Verkäufe wiegen schwerer, weil dieses Kapital den Markt wirklich verlässt und den Preis nachhaltiger drücken kann.
Lasst euch nicht von einfachen Aussagen in die Irre führen. "Marke überschritten, Bullenmarkt bestätigt, ab jetzt geht es nur noch nach oben." Wer so an die Sache rangeht, gehört am Ende wieder zur breiten Masse, die falsch liegt.
Ob der übergeordnete Trend wirklich gedreht hat, entscheidet sich in der Korrektur.
Wie seht ihr das? Bullenmarkt bestätigt oder erst nach dem ersten Test der Cost Basis?
SAUDI ARABIA’S ENTIRE OIL INFRASTRUCTURE & INDUSTRY IS BEING DISMANTLED IN REAL TIME.
NO MATTER IF THE WAR ENDED TOMORROW, IT WILL TAKE YEARS TO REBUILD. SO, THE 2nd LARGEST OIL PRODUCER WILL BE OUT OF BUSINESS FOR THE FORESEEABLE FUTURE.
THANK YOU MR TRUMP FOR YOUR ATTENTION TO THIS MATTER.
In an ongoing ballistic missile attacks, Yemen has struck Jeddah, Taif, and Jizan areas of #SaudiArabia
Significant damages have been reported. King Fahd airport was struck twice too.
Multiple cities have been alerted for missile attacks.
For the first time since the start of the war, Sanaa targets Yanbu port with dozens of ballistic missiles, taking it out of service in the meantime
Yanbu port is one of the most important Saudi ports, with approximately 7,000,000 barrels of oil exported daily through it to the world
We're publishing our most detailed threat intelligence report to date.
It covers how people tried to misuse Claude—for cyberattacks, influence operations, surveillance, biology, and building weapons—and how we found and stopped them.
We disrupted every operation in the report, and used the lessons from them to strengthen our safeguards. Where appropriate, we also shared what we found with authorities and other AI companies.
These cases are not typical: we’re highlighting some of the most sophisticated misuse we’ve seen. But they’re especially important to discuss, because they show us where AI misuse is headed, where our safeguards work, and where they need to improve.
We’re publishing this report so others can spot the same activity on their own platforms, and so we can give the public a clearer view of how emerging threats develop.
Read the report: https://t.co/0EJUnYEgfz
@FinanzKroko verstehe den Sinn von Dividenden bis heute nicht so recht. Wenn eine Aktie bei 100$ steht und 3% Dividenden ausgibt, steht die Aktie danach doch bei 97$ und du bekommst 3$ auf den Konto. Bei nicht dividenden Aktien kann ich doch 3$ der Aktie verkaufen und komme auf das selbe
@gerald_young23 verstehe den Sinn von Dividenden bis heute nicht so recht. Wenn eine Aktie bei 100$ steht und 3% Dividenden ausgibt, steht die Aktie danach doch bei 97$ und du bekommst 3$ auf den Konto. Bei nicht dividenden Aktien kann ich doch 3$ der Aktie verkaufen und komme auf das selbe