The November 5 U.S. Stock Market Crash Was a Classic Case of Active Selling Triggering Forced Selling: A Market Liquidity Shock
Join our U.S. Stock Investment VIP Community:
https://t.co/Z1DmTsWc6U
Today, I came across a Bloomberg article analyzing the previous day's U.S. stock market selloff, titled “Anatomy of a Selloff: Sudden Chain Reaction Rattles Wall Street.” It is well worth studying.
The central takeaway: The November 5 U.S. stock market crash was not simply a case of investors turning bearish on AI. It was a classic market liquidity shock in which active selling triggered passive selling.
Retail investors started selling. Hedge funds, traditional institutions, and quantitative trading systems followed. Negative-Gamma hedging by options market makers further amplified the decline.
Image
The U.S. stock market lost approximately $3.7 trillion in market capitalization that day. However, that does not mean $3.7 trillion in cash actually flowed out of the market.
What Really Happened During a U.S. Stock Market Selloff That Wiped Out $3.7 Trillion in Market Value?
It was an extremely unusual trading session. Approximately $3.7 trillion in U.S. stock market value disappeared in a single day.
Ironically, the initial selling was not triggered by a major negative announcement from any particular company. It began with retail investors taking profits.
But what turned an ordinary wave of selling into a snowballing market collapse was the automated trading machinery operating throughout the market.
U.S. Stock Market Insights breaks down the sequence of events as follows:
Stage 1: Retail Investors Started Selling
Retail investors were the initial driving force behind the selloff.
According to Vanda Research, net selling in individual stocks by U.S. retail investors on November 5 ranked as the third-largest on record.
Only two trading sessions during the March 2020 COVID-19 panic saw greater retail net selling.
Stage 2: Hedge Funds and Traditional Institutions Followed
After retail investors began selling, hedge funds started reducing their positions. Traditional long-only funds then joined the selling.
One important motivation for these funds was to protect the investment gains they had accumulated since the beginning of 2026 and prevent further market declines from eroding their annual profits.
Even more concerning was the lack of large buyers willing to absorb the selling pressure.
In other words, the number of sellers kept increasing while available buying liquidity remained insufficient.
Stage 3: Three Types of Quantitative Trading Strategies Triggered Heavy Selling
This was the critical stage that amplified the market decline.
These strategies do not require portfolio managers to make real-time judgments about the underlying value of companies. Instead, they automatically adjust positions based on price movements, volatility, or predefined risk rules.
1. CTA Trend-Following Funds: $13 Billion
Commodity Trading Advisors (CTAs) originally focused primarily on commodity futures. Today, many CTA strategies also trade equity index futures extensively.
When the S&P 500 and Nasdaq broke below key technical levels, trend-following models generated sell signals.
Vanda estimated that these strategies sold approximately $13 billion in S&P 500 and Nasdaq index futures.
2. Volatility-Control Funds: $61 Billion
These funds dynamically adjust their equity exposure to keep portfolio risk within a targeted range.
When market volatility suddenly rises, they are required to reduce their risk exposure.
On November 5, the VIX surged sharply. Based on the market conditions at the time, Nomura Securities estimated that these funds needed to reduce their equity holdings by approximately $61 billion.
3. Leveraged ETFs: $47 Billion
Leveraged ETFs must maintain a predetermined daily leverage target, such as 2x or 3x.
When the stock market drops sharply, bullish leveraged ETFs generally need to sell stocks or reduce derivatives exposure to rebalance their leverage ratios.
Nomura Securities estimated that this mechanism could have generated approximately $47 billion in additional selling demand before the market close.
Stage 4: Negative-Gamma Hedging by Options Market Makers Further Amplified the Decline
There was another force in the market that ordinary investors often overlook: the dynamic hedging activity of options market makers.
When market makers are collectively in a negative-Gamma, or short-Gamma, position:
As the stock market falls, they need to sell more stocks or equity index futures to hedge their exposure.
That additional selling pushes stock prices even lower.
As prices continue falling, even more hedging-related selling is triggered.
Nomura Securities estimated that every additional 1% decline in the market could generate approximately $7 billion in additional hedging-related selling pressure.
As a result, the market entered a vicious cycle:
Retail and institutional investors actively sell.
Stock prices break below technical levels, and the VIX rises rapidly.
CTAs sell futures.
Volatility-control funds reduce their positions.
Leveraged ETFs rebalance.
Negative-Gamma hedging adds another layer of selling pressure.
Stock prices fall further, triggering another round of selling.
One important clarification about these figures: The $13 billion attributed to CTAs is Vanda's estimate of trading volume. The $61 billion and $47 billion figures are primarily Nomura model estimates of potential position reductions or expected rebalancing requirements. The $7 billion figure represents estimated selling sensitivity for every 1% market decline.
These figures cannot simply be added together, nor should they all be treated as actual completed sell orders.
II. The VIX Went From Extreme Calm to Panic in a Single Session
Original Headline: Only Two VIX Spikes Have Started Calmer and Gone Further
Translation: Since 1990, there have been very few instances in which the VIX started from such a low level and experienced such a dramatic single-day surge.
Image
The horizontal axis shows the VIX's single-day point change, while the vertical axis represents the VIX closing level on the previous trading day.
November 4: VIX at 16.61
November 5: VIX at 28.18
Single-day increase: +69.7%
This was the third-largest single-day percentage increase in the VIX since 1990, trailing only February 5, 2018, and December 18, 2024.
Key takeaway:
Under normal circumstances, market risk tends to build gradually, and the VIX generally rises over time.
But this time, the VIX jumped directly from 16.61 to 28.18, indicating that the market repriced risk dramatically within an extremely short period.
Why is this so dangerous for the market?
Many quantitative strategies had established relatively large equity exposures based on the low-volatility environment that preceded the selloff.
A sudden spike in volatility forced them to reduce risk. This potentially created a second wave of selling, adding to the initial selling driven by fundamentals or investor sentiment.
However, a huge single-day increase in the VIX does not mean market fear has reached an all-time extreme. An absolute reading around 28 remains significantly below the extreme levels recorded during the 2020 COVID-19 crisis.
III. The AI Trade Has Given Back Half of Its Peak Gains
Original Headline: The AI Trade Has Given Back Half, Its Deepest Pullback Yet
Translation: The AI investment trade has retraced more than 50% from its peak, marking the deepest pullback of the current rally.
This chart tracks a Goldman Sachs basket of stocks highly sensitive to AI memory demand. It does not represent the entire AI sector, much less the Nasdaq index.
Goldman Sachs AI Memory-Related Stock Basket: Cumulative Returns
Starting from November 30, 2022, the chart compares the 2026 peak with November 5.
One point is particularly easy to misinterpret:
The decline from a cumulative gain of 1,202% to a cumulative gain of 540% does not mean the basket lost 662% of its total gains. It represents an approximately 51% decline in the basket's net value relative to its peak.
Compared with the 44% drawdown recorded on April 8, 2025, this latest decline is more severe. Its duration is also worth monitoring.
The original Bloomberg report also provided several important data points:
On November 5, baskets of AI memory, optical communications, data center, and AI semiconductor stocks fell approximately 12%–15% in a single session.
Excluding AI-related stocks, the S&P 500 declined approximately 2.3% that day.
Several AI-themed stock baskets experienced their worst single-day declines since the launch of ChatGPT.
This shows that the November 5 selloff was not simply an evenly distributed market-wide liquidation. Selling was heavily concentrated in the AI supply chain, where stocks had previously posted substantial gains and investor positioning had become crowded.
IV. I Believe the Original Article Overlooked an Important Factor
The original article attributes the crash to retail profit-taking that triggered a chain reaction. This explanation is valuable, but incomplete.
It explains why the market fell so quickly. It does not fully explain why investors suddenly decided to sell.
Both the original Bloomberg report and Reuters mentioned that after the November 3, 2026, U.S. midterm elections, Democrats gained control of both chambers of Congress. The market began reassessing the political and regulatory risks facing the expansion of AI data centers.
The market initially rallied on November 4, but began repricing these risks on November 5. At the same time, positioning in the AI trade had already become extremely crowded.
I would therefore break this selloff into three layers:
LayerMain Driving FactorsMarket ImplicationsFirst layer: CatalystsPolicy changes and a reassessment of AI infrastructure risksTriggered active sellingSecond layer: PositioningCrowded AI exposure and funds locking in profitsIntensified active sellingThird layer: Market structureCTAs, volatility-control funds, leveraged ETFs, and negative GammaAmplified the decline and volatility
The real risk to watch is whether the first layer continues to deteriorate.
If the selloff is primarily driven by the second and third layers—position reductions and mechanical deleveraging—the market could rebound quickly once the selling pressure is exhausted.
But if the first layer causes investors to continue lowering expectations for AI capital expenditures and corporate earnings, the end of mechanical selling does not necessarily mean the market has found a bottom.
V. What Should Investors Watch Next in the U.S. Stock Market?
On Friday, November 6, the Nasdaq 100 had already rebounded by nearly 2%. However, the VIX remained near 28, suggesting that although the market had recovered some ground, investor concerns about risk had not completely disappeared.
I recommend focusing on four signals:
1. The VIX and Its Term Structure
If the VIX declines and the volatility structure between near-term and longer-dated contracts returns to normal, it could indicate that market-wide de-risking pressure is beginning to ease.
2. Whether Quantitative Funds Have Finished Reducing Exposure
Watch CTA positioning, the target exposure of volatility-based strategies, and ETF rebalancing demand near the market close.
3. Relative Strength Across Core AI Stocks
Monitor whether $MU, $MRVL, and $NVDA , along with optical communications stocks such as $LITE and $COHR, begin stabilizing ahead of the broader market rather than simply following an index rebound.
4. Credit Risk Among AI Companies
Reuters reported on November 6 that CoreWeave's five-year credit default swap (CDS) spread had exceeded 1,000 basis points, indicating growing concern about financing risks in AI infrastructure.
However, at that time, U.S. Treasuries and the broader financing markets had not shown comparable signs of systemic stress.
VI. Final Investment Assessment
Based on our analysis, this selloff involved two distinctly different forces: a repricing of AI industry valuations and policy expectations, and forced de-risking triggered by market structure.
These two forces have very different investment implications.
If forced deleveraging is the primary driver, high-quality AI stocks could stage a strong rebound once selling pressure subsides.
But if AI capital expenditures, project financing, and earnings forecasts begin deteriorating persistently, any rebound may simply be a temporary recovery within a much longer correction.
One point deserves special emphasis: A 51% drawdown in Goldman Sachs' AI memory stock basket is neither proof that the AI bubble has already burst nor proof that these stocks are automatically bargains worth buying right now.
At this point, what matters most to me is not how much the VIX has risen. It is whether genuine buyers are willing to step back into AI stocks once mechanical selling comes to an end.
That is the key dividing line between a rebound following a liquidity shock and a broader repricing of valuations across the AI industry.
# Chip Stocks Stage a Massive Rebound: Is It Time to Buy the Dip or Get Out?
This is Stock Market Insights. I'll see you next time.
**Join our U.S. Stock Investment VIP Community:**
https://t.co/Z1DmTsWc6U
The chip stocks that took the biggest beating on Thursday became Friday's biggest rebound leaders. $AMD surged more than 11%, $INTC gained nearly 8%, while $QCOM and $MU both climbed more than 5%. The semiconductor ETF finished the session up 3.62%.
If you stayed on the sidelines Thursday, seeing those gains on Friday probably made you wonder whether you missed the perfect buying opportunity.
But don't jump to conclusions just yet. There's one detail worth paying attention to: **Chip stocks started rebounding before the October jobs report was even released.**
So what really drove Friday's rally? Was fresh institutional money moving back into semiconductor stocks, or did prices simply bounce because the wave of forced selling from Thursday had temporarily subsided?
## Chip Stocks Lead the Market Rebound
On Thursday, investors were already concerned that the post-election environment could bring tighter restrictions on data center approvals and AI regulation.
Technology was also one of the most crowded trades in the market. When investors rush to reduce exposure at the same time, losses can quickly become amplified.
Trading desk estimates tracked by U.S. Stock Market News and its StockWe platform suggested that retail investors were net sellers of approximately $3.3 billion in stocks on Thursday.
Meanwhile, late-session leveraged ETF rebalancing involved roughly $60 billion in equity exposure, with an estimated 90% concentrated in technology stocks.
By Friday's premarket session, $NVDA and several memory stocks were already showing signs of recovery.
My interpretation is that once Thursday's wave of urgent selling had passed, even a relatively modest amount of buying pressure could push prices higher. CTA trend-following strategies had also turned bearish, potentially creating room for subsequent short covering.
However, there's an important distinction here: **Price action alone cannot tell us how much of Friday's buying came from short covering versus genuine new capital entering the market.**
That's a distinction investors should not ignore.
## Strong Nonfarm Payrolls Raise Rate Expectations
At 8:30 a.m. Eastern Time, the October nonfarm payroll report showed an increase of 165,000 jobs, significantly above the 65,000 expected in a Reuters survey.
The unemployment rate declined to 4.1%, while average hourly earnings increased 0.4% month over month.
Following the release, **market-implied expectations for a December rate hike reportedly increased from approximately 70% to 78%.** The 10-year Treasury yield also moved from 4.84% late Thursday to 4.86%.
Stronger-than-expected employment data suggest that the economy still has some near-term resilience.
But for companies that need to borrow money today to build computing infrastructure and may not recover those investments for several years, higher financing costs change the economics of those projects.
The returns need to be higher to justify the capital expenditure.
The jobs report did not derail the semiconductor rebound, but it also failed to provide a convincing reason for buying to spread across the broader market.
## Anthropic Revenue Surges, but AI Financing Remains Tight
On the AI demand side, there's another development worth watching.
According to The Wall Street Journal, Anthropic's annualized revenue run rate exceeded $80 billion as of the end of October. At the same time, some investors reportedly remain skeptical about whether the company could support a $1.5 trillion valuation in a potential IPO.
These two developments are not necessarily contradictory.
Customers can continue increasing their AI usage while investors question whether the asking price is justified.
An $80 billion annualized revenue run rate is a projection based on the company's recent revenue pace. It is not the same as confirmed full-year revenue.
To determine the actual value of this business, investors still need to examine whether customers can sustain their spending and how much cash remains after paying enormous computing and infrastructure bills.
At the same time, five-year credit default swap spreads for CoreWeave reportedly briefly exceeded 1,000 basis points.
That creates an interesting contrast.
Equity investors are willing to step into semiconductor stocks after a sharp sell-off, while credit markets continue demanding substantial compensation for taking on AI infrastructure financing risk.
**This is one reason I'm not fully convinced by Friday's rebound. AI demand remains strong, but the investors financing the next wave of expansion are still cautious.**
## TSMC Explores 3D DRAM: Who Could Lose Orders?
According to The Information, citing people familiar with the matter, TSMC has begun exploring production plans for 3D DRAM at Nvidia's request. Reuters subsequently followed up on the report.
However, neither company has publicly confirmed the details.
The specific manufacturing process, the GPU generation involved, potential production timelines, and any procurement commitments remain undisclosed.
This development does not explain why semiconductor stocks started recovering before Friday's market open. But it gives TSMC another potential growth opportunity that is somewhat independent of broader market sentiment.
First, let's clarify something important.
HBM is already a form of stacked memory.
Think of it as multiple layers of memory chips stacked together, with a logic base underneath that helps manage communication and connections.
**SK Hynix announced back in 2024 that the logic base for its HBM4 products would use TSMC's advanced logic manufacturing technology.**
In other words, TSMC is already involved in manufacturing the logic base.
The bigger question now is whether TSMC could take another step forward and eventually manufacture the actual memory components responsible for storing data.
## Why Would Nvidia Want TSMC Involved?
Imagine a GPU that is ready to perform its next calculation, but the required data hasn't arrived yet.
The computing units have to wait.
If Nvidia can work directly with TSMC during GPU development to determine where memory should be placed, how it should be connected, and how much energy is required to move data, it could potentially improve the efficiency of each GPU.
There's also a supply-chain consideration.
**If this architecture eventually allows Nvidia to source components from multiple manufacturers, the company could gain additional leverage when allocating orders and negotiating prices.**
**But if only TSMC can manufacture the technology, Nvidia may gain another technical option while potentially increasing supply-chain concentration.**
That distinction matters.
A new manufacturing partner does not automatically mean a more diversified supply chain.
## The Memory Giants Need to Watch How Much HBM Each GPU Uses
If TSMC ultimately focuses on the logic base and advanced packaging, this would represent an expansion of its existing role in the AI semiconductor supply chain.
TSMC could capture more customized manufacturing and packaging business, while Samsung, SK Hynix, and Micron would continue supplying DRAM dies and stacked memory products.
Even if TSMC successfully develops specialized 3D DRAM, investors still need to understand exactly how Nvidia intends to use it.
For example, if the new memory sits closer to the GPU and handles latency-sensitive workloads, it could coexist with HBM, which would continue providing high-capacity, high-bandwidth memory.
In that scenario, the two technologies could complement each other rather than directly compete.
The real threat to traditional memory suppliers would emerge if the new architecture replaced part of HBM's workload and reduced the amount of HBM required per GPU.
But getting there would require successful customer validation, acceptable manufacturing yields, competitive costs, and the ability to deliver products at commercial scale.
Until those conditions are met, it is too early to assume that TSMC will take meaningful market share away from the established memory manufacturers.
## My Take: A Technical Rebound Is Not the Same as a Confirmed Market Bottom
For Friday's session, I would separate the situation into two different investment considerations.
**From a trading perspective:**
Semiconductor stocks delivered their first meaningful recovery following Thursday's deleveraging pressure.
If major indexes continue climbing next week, CTA strategies that recently turned bearish could begin covering short positions.
However, if market volatility remains elevated, trading desk models still estimate that approximately $50 billion in potential reduction exposure could gradually be released.
I would rather see semiconductor stocks hold their gains into the close for several consecutive sessions than chase a single powerful rebound.
I also want to see buying interest spread beyond a handful of heavily weighted technology names.
**From an industry perspective:**
The TSMC 3D DRAM development deserves close attention as Nvidia's next-generation GPU architecture evolves.
Once more concrete product specifications become available, there's one question I want answered:
Will Nvidia use this technology to add another layer of memory to its GPUs, or is it preparing to reduce its dependence on traditional HBM?
For TSMC, either outcome could create another meaningful business opportunity.
For Micron, SK Hynix, and Samsung, however, the difference could be substantial.
**My conclusion: Friday's rally is encouraging, but I wouldn't call it a confirmed bottom just yet.**
The AI infrastructure opportunity remains real. But investors still need to distinguish between strong end-user demand, sustainable financing, and the actual profitability of the companies building this infrastructure.
In this market, buying the dip without understanding what is driving the rebound can be just as dangerous as selling in a panic.
**What do you think? Was Friday's semiconductor rally the beginning of a new recovery, or simply a temporary bounce after an aggressive wave of forced selling?**
$GOOGL — Google’s TPU Strategy Could Turn AI Infrastructure Into Its Next Major Profit Engine
The AI Chip War Is Becoming a Cloud Business War
What if Google's biggest opportunity in artificial intelligence is not selling more search advertising, but controlling the cost of running AI?
For years, investors viewed Google's Tensor Processing Units as internal infrastructure designed to reduce dependence on NVIDIA. That interpretation is becoming outdated.
Google is increasingly positioning TPU as a commercial computing platform that can attract external customers, strengthen Google Cloud, and reduce the cost of operating its own AI services.
The November 5 SemiAnalysis research on TPUv7 Ironwood makes this strategy more interesting. Its AgentX testing showed that TPUv7 could deliver competitive or superior performance per dollar on selected workloads, including Qwen3.5 and GLM models. However, NVIDIA's FP4 configurations remained substantially stronger on certain other workloads.
This is not a universal victory for Google. It is evidence that customers have another credible option.
Why $GOOGL Could Benefit Beyond Chip Sales
There are three potential sources of value.
First, Google can use its own $TPUs to reduce the cost of operating Gemini and other AI services.
Second, external TPU customers can generate additional demand for Google Cloud infrastructure.
Third, a stronger hardware offering gives Google more negotiating power when competing for large enterprise AI contracts.
But there is an important financial complication.
Reuters reported on October 29 that Google's expanding TPU business requires substantial upfront investment in hardware, inventory, and data centers. This creates working-capital pressure and can weaken near-term free cash flow, even when demand is strong.
Reuters
That distinction matters. Growing revenue does not automatically mean growing profitability.
What I Would Watch
Google Cloud revenue growth and operating margins.
External TPU adoption beyond Google's own ecosystem.
Infrastructure spending versus free cash flow.
Whether TPU customers become long-term cloud customers.
Whether Google can monetize AI without sacrificing margins.
My View
I am constructive on $GOOGL because TPU gives the company an opportunity to improve both its cost structure and competitive position in cloud computing.
However, I would not value every dollar of TPU demand as immediately profitable revenue.
The real investment question is whether Google can turn its engineering advantage into recurring, high-margin cloud economics.
$WFF — Small-Cap Investing Is About Financial Survival, Not Just Cheap Shares
This is Stock Market Insights. I'll see you next time.
Join our U.S. Stock Investment VIP Community:
https://t.co/Z1DmTsWc6U
Good morning, everyone. Welcome to Stock Market Insights. Today, I want to take a closer look at $WFF and the broader environment facing smaller industrial companies.
Thursday's market sell-off was a reminder that investors are becoming less willing to pay high valuations for uncertain future growth. The Nasdaq lost 5.52%, while the S&P 500 declined 4.36%. On Friday morning, the Nasdaq recovered 1.23% at the opening bell, but the Dow remained under pressure. This divergence suggests that investors were selectively buying technology shares rather than confidently returning to the entire market.
For WF Holding, the important question is whether its fiberglass industrial products business can generate sustainable revenue and operating cash flow. Investors should examine customer demand, order visibility, manufacturing costs, financing arrangements and potential shareholder dilution.
A low share price does not automatically mean a company is undervalued. Financing can provide necessary liquidity, but new shares or warrants can also affect existing shareholders.
My personal view is that $WFF deserves a fundamentals-first approach. I would rather see stronger operating evidence than speculate on a short-term rebound. Cash preservation and capital discipline matter more than optimistic headlines.
As always, retirement planning should be built around diversified assets and long-term financial stability, not concentrated exposure to speculative small-cap stocks.
Thank you for joining me today. May God grant us wisdom and peace. I'll see you next time.
#WFF #SmallCapStocks #RiskManagement
$WFF | The difference between a business and a stock
Join our U.S. Stock Investment VIP Community:
https://t.co/Z1DmTsVEhm
Good morning, everyone. Welcome to my market briefing.
$WFF deserves a closer look, but I want investors to separate the company's industrial business from the behavior of its stock. WF Holding operates in fiberglass-reinforced products used in industrial infrastructure, water treatment and other applications. These are real business areas, but that alone does not establish shareholder value.
What matters now is revenue quality, operating cash flow, financing arrangements and potential dilution. In a market where investors are becoming less tolerant of speculative valuations, financial transparency matters more than promotional headlines. I'd rather see consistent execution than chase a sudden move.
This is Stock Market Insights. I'll see you next time.
#WFF #StockMarket #RiskManagement
Part 1: AI Chip Stocks Are Crashing Across the Board. Wall Street's Real Fear Isn't Nvidia's Decline—It's That Hundreds of Billions of Dollars in Investment May Never Pay Off
In-Depth Market Risk Analysis
When $NVDA, $AMD, and $MU are all being sold off by institutional investors, investors need to ask one important question: Has the AI industry actually reached an inflection point in demand, or is Wall Street finally beginning to question the return on this massive investment boom?
On November 5, U.S. technology stocks came under intense selling pressure.
The Nasdaq fell nearly 4%, while semiconductor stocks experienced one of the sharpest concentrated sell-offs in recent years. Nvidia, AMD, Micron, and several AI infrastructure companies were at the center of the decline.
According to the Associated Press, the S&P 500 fell 4.4% that day, the Nasdaq dropped 5.5%, Nvidia declined 9.3%, and AMD plunged 17.3%. This was no longer an ordinary technical pullback.
AP News+1
More importantly, this sell-off wasn't triggered by a single company's earnings report.
The market is reassessing three major questions simultaneously:
First, how much return can technology giants actually generate from the hundreds of billions of dollars they are investing in AI infrastructure?
Second, could future data center construction in the United States face tighter policy restrictions and electricity constraints?
Third, if institutional investors begin reducing their exposure to AI-related assets, where should valuations across the entire semiconductor supply chain be reset?
These three questions may matter more than Nvidia's revenue growth next quarter.
1. Why Is This Sell-Off Spreading So Quickly Across the Entire AI Supply Chain?
Let's start by looking at the business model behind the AI industry.
Over the past two years, AI has developed a very clear capital flow structure.
Microsoft, Amazon, Google, and Meta have increased capital expenditures, purchasing GPUs, building data centers, and expanding their server and networking infrastructure.
Those investments initially translate into orders for suppliers such as Nvidia, AMD, Broadcom, Marvell, and Micron.
Cloud computing companies then lease computing capacity to OpenAI, Anthropic, and other enterprise customers.
Finally, AI application companies generate revenue through subscriptions, advertising, enterprise software, and automation services.
On the surface, the entire industry looks incredibly strong.
But there's one important issue that investors can easily overlook:
Revenue recognized by upstream equipment suppliers does not mean the AI industry as a whole has generated an equivalent amount of commercial returns.
Imagine a cloud computing company purchases $10 billion worth of AI servers.
For the chip supplier, that's a real order.
But for the cloud provider, that $10 billion is initially a capital investment. The company still needs to recover the cost of the equipment, electricity, maintenance, and financing through future computing service revenue.
If customers downstream aren't paying enough to cover those costs, upstream suppliers may continue receiving substantial orders while the overall investment returns across the supply chain remain under pressure.
That's exactly what Wall Street is beginning to focus on.
2. What Does $720 Billion in AI Capital Spending Actually Mean?
According to recent industry reports, Amazon, Microsoft, Alphabet, and Meta have combined 2026 capital expenditure plans totaling at least $720 billion, with a substantial portion allocated to AI infrastructure.
That is an extraordinary amount of money.
But investors shouldn't focus solely on the size of capital expenditures. They also need to understand the time gap between investment and returns.
Data centers take time to build.
GPUs take time to procure.
Servers take time to deploy.
Even after customers sign computing contracts, it takes time to turn that capacity into actual revenue.
As a result, there can be a substantial delay between rising capital expenditures and improving free cash flow.
If the market continues raising expectations for AI revenue growth while companies' cash flow fails to keep pace, valuations could gradually lose their support.
This becomes particularly important when technology giants increasingly rely on bond financing. Interest rates and credit risk then become additional factors in how AI stocks are valued.
Recent market reports have already highlighted financing pressure from AI infrastructure expansion as an important factor driving investors to reassess technology stocks.
Bisnow+1
3. Nvidia, AMD, and Micron: Which Company Faces the Greatest Risk?
We need to analyze these three companies separately.
$NVDA: Its biggest advantage is its ecosystem. Its biggest risk is customer capital spending.
Nvidia has a powerful GPU lineup, a strong software ecosystem, and a deep developer base.
However, its growth still depends heavily on continued investment from data center customers.
If Microsoft, Amazon, and Google adjust their purchasing plans, or if certain data center projects are delayed, the market may reassess Nvidia's order growth over the next several quarters.
That doesn't mean AI demand has disappeared.
The real questions are whether orders continue growing and whether customers are willing to purchase next-generation products at the same prices and pace as before.
$AMD: The market needs to determine whether it can continue gaining share in the AI accelerator market.
AMD's opportunity comes from enterprise customers looking to reduce their dependence on a single GPU supplier.
But gaining market share does not automatically mean profit margins will increase at the same pace.
If AMD needs to offer more competitive pricing to win orders while continuing to invest heavily in its software ecosystem, investors will need to reassess its long-term profit potential.
$MU: HBM demand remains important, but not all memory demand should be treated as AI demand.
AI servers require high-bandwidth memory, creating a long-term growth opportunity for Micron.
However, if expectations for AI server shipments slow, HBM procurement plans could also be affected.
In addition, the memory industry itself is cyclical.
Investors still need to monitor the supply-demand balance for conventional DRAM and NAND, inventory levels, contract pricing, and capital expenditures.
Strong AI demand alone is not enough to assume that prices across every memory product category will continue rising.
4. The Real Danger May Be a Chain Reaction Among Institutional Investors
There's another factor the market frequently overlooks.
Institutional portfolios are interconnected.
When a group of large funds holds semiconductor, cloud computing, and AI infrastructure stocks simultaneously, a significant portfolio drawdown may force them to reduce overall risk exposure.
In that situation, the stocks being sold aren't necessarily the companies with the weakest fundamentals.
They may simply be the most liquid assets and the easiest positions to convert into cash.
This can result in even high-quality companies being sold alongside weaker names.
However, we cannot conclude that certain funds have blown up or been forced to liquidate simply because stock prices have plunged. Such claims require supporting evidence from fund disclosures, financing data, or reliable reporting.
5. Is This Sell-Off an Opportunity or a Turning Point for the AI Bull Market?
I believe the most important thing right now isn't guessing which day the market will rebound. It's determining whether investment returns across the AI industry are beginning to diverge.
If AI demand remains strong and enterprise customers continue purchasing computing capacity, this sell-off may primarily reflect valuation adjustments and portfolio repositioning.
But if capital expenditures keep rising while actual commercial revenue fails to keep pace, the market could enter a much longer period of valuation compression.
My view:
I'm not rushing to buy the dip in $NVDA, $AMD, or $MU in the short term.
I'd rather wait for three signals:
Whether major technology companies maintain their existing AI capital expenditure plans.
Whether AI cloud service revenue continues growing and gradually translates into stronger cash flow.
Whether there are actual delays or cancellations in GPU, HBM, and server orders.
The AI revolution may continue, but AI stocks won't necessarily trade according to the same valuation logic that dominated the past two years.
Going forward, the market may stop rewarding companies simply because they have the largest capital expenditure budgets or the most ambitious construction plans. Instead, investors may increasingly favor businesses that can genuinely convert AI demand into profits and free cash flow.
That's what makes this round of AI market corrections worth watching so closely.
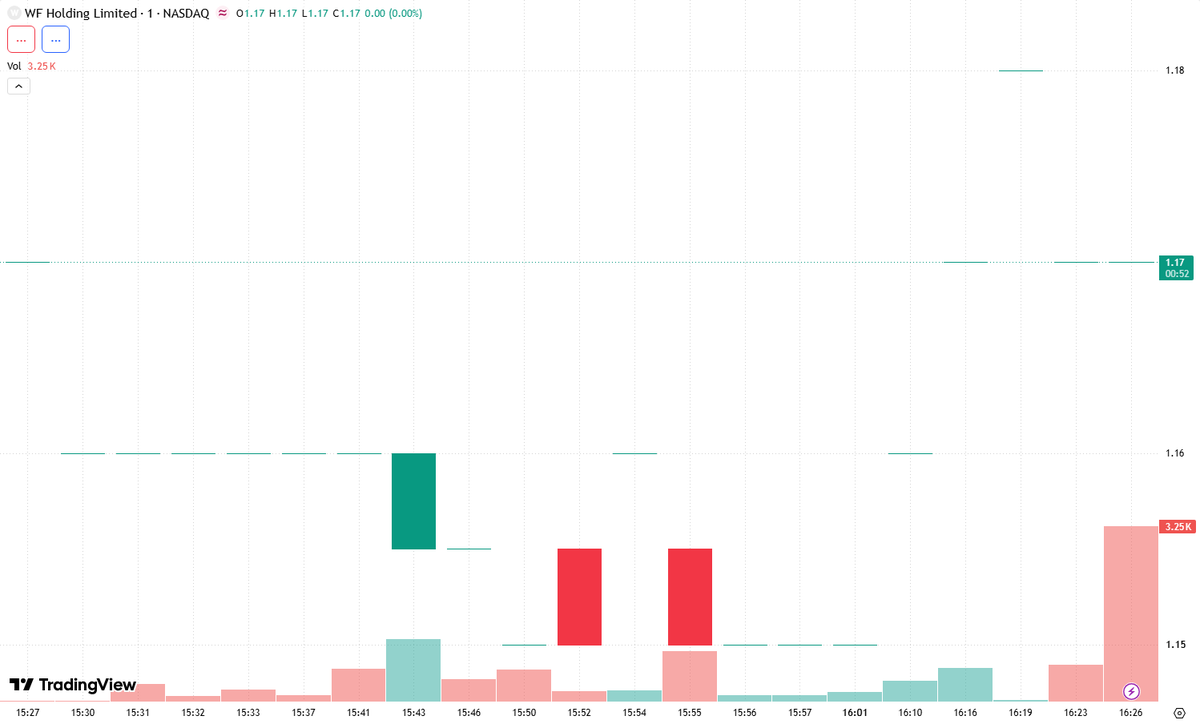
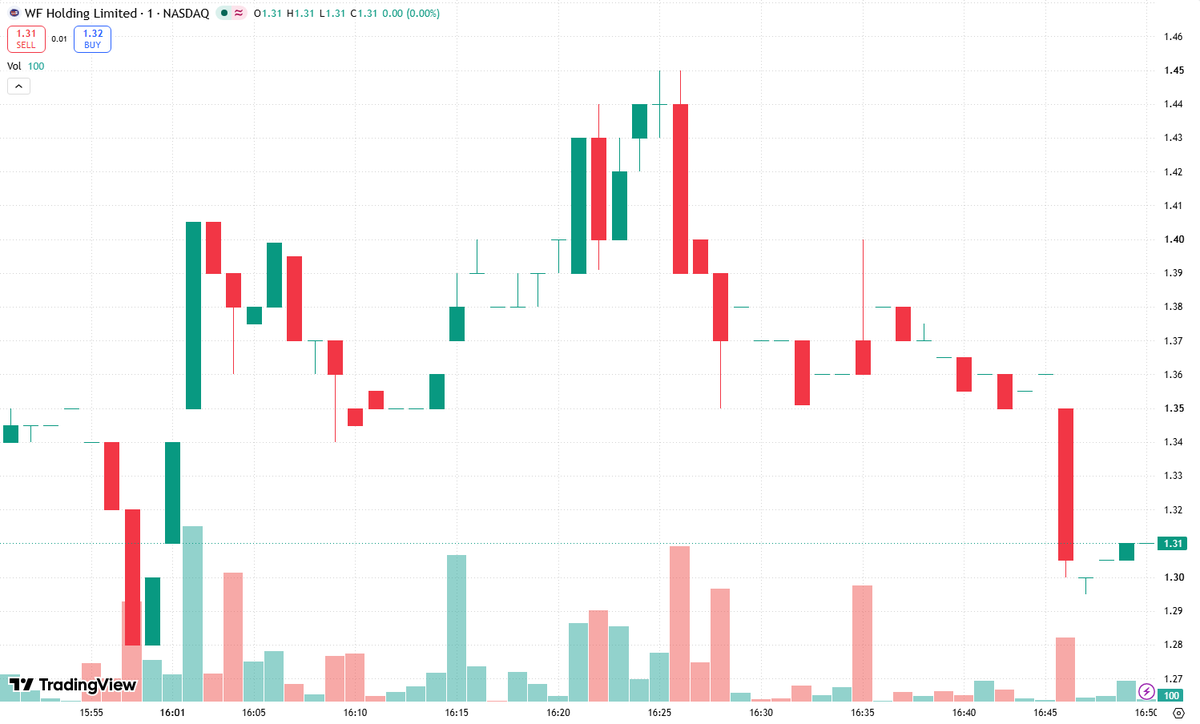
That sudden $WFF dump looks suspicious as hell. If there’s no fresh bad news, what exactly changed besides somebody deciding to hammer the bid?
“Pure manipulation” is the first thought—but the chart alone can’t prove it. Was this algorithms hunting obvious stop-loss levels, triggering forced selling, and handing cheaper shares to bigger players? That’s the question worth asking before calling this normal price discovery.
I’m not buying the idea that every violent flush reflects fundamentals. Someone may be using panic to accumulate lower.
Don't let them shake you out—but don’t confuse suspicion with evidence, either. Manage your risk, not their narrative.
#Stocks #Trading #MarketManipulation
That sudden $WFF dump smells like Algo games. If there’s no fresh bad news, what exactly changed besides somebody deciding to hammer the bid?
Funny how these “random” flushes always seem designed to scare retail into selling at the worst possible moment. Smash the price, trigger clustered stop orders, scoop up cheap shares—is that the playbook here?
Pure manipulation? I can’t prove who’s behind it, but I’m sure as hell questioning the move instead of blindly trusting it.
Don't let them shake you out. Check the actual news, respect your risk limits, and don’t confuse an ugly candle with a broken investment thesis.
#Stocks #Trading #MarketManipulation
$WFF — Cash Flow Warning
🚨 $WFF: Growth Is Interesting, But Who Is Paying for It?
📢 Join our U.S. Stock Investment VIP Community:
https://t.co/Z1DmTsWc6U
The real test for $WFF isn't whether the company can attract attention. It's whether it can convert demand into profitable business. Industrial expansion creates opportunities, but working capital and production costs deserve equal attention.
Three risks deserve attention:
Customer orders do not automatically become collected cash.
Additional capital requirements could pressure existing shareholders.
Weak operating execution could undermine the growth narrative.
My View: I would rather wait for stronger financial confirmation than chase speculation. I'm cautiously bullish on the business opportunity, but cash generation must eventually support the valuation. If you're following $WFF, send me a DM. I'm always interested in hearing another trader's perspective.
This is Stock Market Insights. I'll see you next time.
#WFF #CashFlow #StockMarket
# 02. The Memory Chip Boom Is Accelerating: Could Micron and SanDisk Be the Next Big Winners?
**Join Our FREE U.S. Stock Market Community:** Get daily semiconductor analysis, AI investment ideas, and risk alerts.
https://t.co/Z1DmTsWc6U
For the past two years, investors have focused heavily on GPUs and AI servers.
But another part of the semiconductor industry deserves more attention: memory.
AI training, inference, and expanding data centers all require enormous amounts of high-performance memory and storage.
That could create a powerful long-term opportunity for memory manufacturers.
### 1. Why Is Memory Becoming So Important?
AI servers require high-bandwidth memory, DRAM, and high-speed storage.
As AI infrastructure expands, demand for memory capacity and performance increases.
For memory companies, the most important factors are not AI headlines. They are pricing power, shipment growth, production capacity, and gross margins.
### 2. Which Companies Deserve Attention?
- ** $MU:** Micron, with a focus on HBM, DRAM, and profitability.
- ** $SNDK :** SanDisk, with a focus on $NAND demand and pricing.
- ** $WDC:** Western Digital, with exposure to enterprise storage and hard drives.
- **$STX:** Seagate, with exposure to data center storage and HAMR technology.
### 3. What Could Go Wrong?
Memory is a cyclical industry.
If manufacturers expand production too aggressively, or AI demand slows, pricing could reverse quickly.
Today's tight supply conditions should not automatically be treated as a permanent shortage.
**My Take:**
We remain constructive on the long-term memory demand outlook.
However, we prefer companies with strong technology, healthy balance sheets, and the ability to convert demand into sustainable profits.
The biggest winner may not be the stock with the strongest rally. It may be the company with the strongest earnings execution.
---
$WFF — Customer Concentration May Be an Overlooked Risk
🔥 Join Our U.S. Stock Investment VIP Community
Get market insights, stock discussions, and trading ideas with our community.
👉 Join here:
https://t.co/Z1DmTsWc6U
Market open: Dow 52,784.48 | S&P 500 7,655.43 | Nasdaq 25,643.36. $WFF's opening price was not independently verified.
One issue I would not overlook with $WFF is customer concentration.
For a smaller industrial supplier, losing one major customer or experiencing a delay in a large project can have a meaningful impact on quarterly results.
I would want to know whether revenue is diversified across customers and industries, whether orders are recurring, and whether the company has enough pricing power to handle rising input costs.
A company can report impressive growth while still carrying considerable operational risk.
My position is that the quality and durability of revenue deserve as much attention as the headline growth rate.
Which company do you like better? If you could choose only one, which would you buy, and which would you avoid for now? Share your reasoning in the comments.
This is Stock Market Insights. I'll see you next time.
$WFF: Three Warning Signs Investors Should Never Ignore in Low-Priced Stocks
Sometimes investors lose money not because they misunderstand an industry, but because they underestimate a company's capital structure.
Today, we're looking at $WFF again, but this time from a risk-management perspective.
In my opinion, there are three warning signs investors should pay close attention to when analyzing low-priced small-cap stocks.
1. Frequent financing announcements
A company needing capital isn't automatically a bad thing. The important question is what that money will accomplish.
Is the financing being used to expand production capacity and generate future revenue, or is it primarily being used to cover ongoing operating expenses?
If additional capital doesn't lead to stronger revenue and profitability, financing may simply extend the company's runway without improving its underlying business.
2. Changes in the share count
Many retail investors focus entirely on the stock price while overlooking the number of shares outstanding.
If a company's business doesn't grow meaningfully but its share count keeps increasing, each existing share may represent a smaller ownership interest.
3. Price action without sustainable volume
Low-priced stocks can experience sharp rallies over short periods. But if those moves aren't supported by sustained trading activity, liquidity can become a serious concern.
Getting into a position is one thing. Being able to exit at a reasonable price is another.
My approach to $WFF remains cautious rather than outright bearish.
If the company demonstrates stronger orders, improving margins, and lower dependence on external financing, the market may eventually have a reason to reassess its valuation.
Until then, a low share price alone is not a reason to buy.
Cheap doesn't automatically mean undervalued, and undervalued doesn't mean a stock has to rally immediately.
Which company do you like better? If you could choose only one, which would you buy, and which would you avoid for now? Share your reasoning in the comments.
This is Stock Market Insights. I'll see you next time.
Join our U.S. Stock Investment VIP Community:
https://t.co/Z1DmTsWc6U
$WFF: Don't Mistake a Relief Rally for a Reversal
A bounce can change sentiment quickly, but it cannot erase a damaged chart overnight. $WFF remains a speculative name where traders need to separate short-term excitement from sustainable demand. The November 3 trading range was wide, and different historical feeds report inconsistent closing figures. I would rather wait than trade on questionable numbers.
Three things concern me:
Extreme price swings create significant downside exposure.
High turnover alone does not establish institutional accumulation.
Financing, liquidity, and execution risks remain important considerations.
I'm cautiously bullish if buyers can establish a higher low and defend recent support. But I wouldn't chase a green candle without confirmation. "Take some chips off the table" is worth remembering here. I still see recovery potential, but the next move needs evidence. Want to compare notes? Send me a DM.
#WFF #SmallCapStocks #Trading
What the hell was that $WFF dump? Where’s the company-specific bad news that supposedly justified it? If nothing material changed, this looks suspiciously like stop hunting: algorithms hammering obvious levels, triggering sell orders, and handing cheaper shares to whoever’s waiting below.
Pure manipulation? I can’t prove it, but I’m not blindly buying the “normal price discovery” excuse either. Someone looking to accumulate would love a sudden wave of panic selling.
Don’t let them shake you out. Check the news, question the move, and follow your own risk limits—not some bot’s apparent attempt to manufacture fear. A violent candle isn’t an investment thesis.
#Stocks #Trading #MarketManipulation
🇺🇸 U.S. STOCK MARKET COMMUNITY 📈
🔥 JOIN OUR FREE WHATSAPP STOCK DISCUSSION GROUP!
👇 CLICK HERE TO JOIN NOW:
https://t.co/4YRviuakXE
Are you passionate about the U.S. stock market? Looking for a place to exchange ideas and stay updated on the latest market developments?
You're welcome to join our growing community of stock enthusiasts and individual investors!
📊 What We Discuss:
✅ Daily U.S. Stock Market News & Updates
✅ Trending Stocks & Market Developments
✅ Technical Analysis & Chart Patterns
✅ RSI, MACD, VWAP & Moving Averages
✅ Support & Resistance Levels
✅ Bullish & Bearish Market Perspectives
✅ Trading Strategies & Risk Management
✅ AI, Technology, Semiconductor & Other Hot Sectors
Whether you're a beginner or an experienced trader, there's always something new to learn.
💡 Share your thoughts, ask questions, exchange trading experiences, and learn from other stock enthusiasts.
🚀 Don't trade alone. Join the conversation and grow your market knowledge together!
👇 JOIN OUR FREE WHATSAPP COMMUNITY TODAY:
https://t.co/4YRviuakXE
Free educational discussions. No guaranteed profits. Always do your own research.
$WFF — The Market Doesn't Reward Blind Loyalty
Here's my concern with $WFF: November 2 delivered another uncomfortable session. The stock opened at $1.30, reached $1.30, fell to $1.00 and finished at $1.10, a decline of approximately 18.52%. Volume was around 2.85 million shares. The previous session recorded approximately 10.28 million. That reduction in activity doesn't automatically mean sellers are exhausted. The price structure still needs confirmation, and I won't pretend to know its exact VWAP or RSI without verified intraday readings.
I'm still constructive on the long-term potential of the American equity market, but $WFF needs to earn back confidence. My observation points are $1.00 support and $1.30 resistance.
Three warning signs:
The stock remains vulnerable below its opening price.
Recent volatility makes chasing rebounds dangerous.
Shareholder dilution risk cannot be ignored.
My preferred approach is patience, not panic buying. Take some chips off the table and wait for buyers to show real commitment. Got a different view? Send me a DM. I'm always happy to debate the tape.
#SmallCapStocks #WFF #RiskManagement
$WFF: The Market Doesn't Reward Hope Forever.
Let's talk about the part of $WFF that deserves more attention than a green candle: shareholder dilution. For smaller companies, financing can keep operations moving, but it can also change the ownership equation for existing investors. The important question isn't simply whether the company can raise capital. It's whether that capital creates enough business value to justify the cost.
Additional share issuance can dilute existing ownership.
Weak liquidity can make downside moves sharper than expected.
A rebound without sustained demand may become another selling opportunity.
I'm still constructive on the long-term potential of healthy U.S. equity markets, but that doesn't mean every speculative ticker deserves unlimited patience. Take some chips off the table when a position becomes oversized. I would monitor the latest verified swing low for support and the previous confirmed rebound high for resistance. A recovery accompanied by stronger volume would be encouraging. Failure to hold the next established low would make me reassess.
A stock can be exciting without being a sensible position size. Those are two very different things.
DM me if you have a different read on $WFF. I enjoy a good bull-versus-bear discussion.
#WFF #SmallCapStocks #Trading
$WFF — A Recovery Needs Fundamental Support
Welcome back to my X. Today's opening rebound suggests that investors are gradually rebuilding confidence after Friday's technology-led selloff. Lower oil prices and stronger manufacturing data have helped improve overall sentiment.
When evaluating $WFF, I believe shareholders should look beyond short-term price movements. The important questions involve revenue visibility, operating margins, financing commitments, and outstanding shares. If the company can demonstrate sustainable business growth, investor confidence may improve. However, without that confirmation, a market rebound alone is not enough to justify excessive optimism. My approach remains cautious and focused on measurable progress.
🚨 $WFF: The Dilution Question Is Bigger Than the Next Green Candle.
There is a difference between a company raising capital to expand and a company repeatedly relying on shareholders to fund its ambitions. Recent October SEC disclosures make the financing structure worth examining carefully.
Three things concern me:
Additional securities registration could create future supply pressure.
Existing shareholders may face ownership dilution if new shares enter the market.
Manufacturing growth means little if margins and operating cash flow fail to improve.
I'm not calling for an immediate collapse. I'm saying investors should understand the financing terms before buying the story. Revenue growth, cash conversion, and share-count changes matter much more than promotional headlines.
My approach is simple: verify the capital structure first, then evaluate the upside. If you're researching $WFF, DM me. Let's compare notes.
#WFF #SmallCapStocks #Dilution
Market Insights | November 2 U.S. Stock Market Morning Briefing
Good morning, everyone. Welcome to Market Insights.
A new trading week is about to begin. Before looking ahead, let's review how the U.S. stock market performed last Friday. October 30 was the previous trading session, and all index figures below reflect official closing prices in Eastern Time, not intraday quotes.
Last Friday, U.S. stocks experienced a significant pullback. The Nasdaq Composite closed at 25,437, down 2.86%. The S&P 500 finished at 7,580.07, down 1.82%, while the Dow Jones Industrial Average settled at 51,770.31, down 1.09%. All three major indexes finished lower, with technology stocks bearing the brunt of the selling.
The main driver of this decline was not simply short-term profit-taking. The market is beginning to reassess the cost of AI investment, the timeline for generating returns, and the pressure that massive spending could place on the cash flows of major technology companies.
Intel plunged approximately 28.6% in a single session, putting significant pressure on the semiconductor sector. Meanwhile, defensive sectors such as energy, consumer staples, utilities, and healthcare held up relatively better. There are signs of capital shifting toward more defensive areas, but it is still too early to conclude that a sustained sector rotation is underway.
Macroeconomic Outlook: The Market's Biggest Concern Is the Return on AI Investment
From a macroeconomic perspective, this correction reflects both shifts in sentiment and a reassessment of fundamentals.
On October 28, the Federal Reserve kept the federal funds rate unchanged at 3.75%–4.00%. However, its statement made clear that inflation remains elevated, and two policymakers favored a rate increase. This means investors should not interpret a rate hold as a guarantee that rate cuts are coming next. The longer interest rates remain relatively high, the harder it becomes for growth stocks to escape valuation pressure.
On the economic growth front, the preliminary estimate showed that U.S. GDP expanded at an annualized rate of 3.4% in the third quarter, up from 2.2% in the second quarter. This suggests that economic activity remains resilient.
However, September CPI rose 3.7% year over year, while headline PCE inflation increased 3.6% and core PCE rose 3.1%. Inflation remains well above the Fed's 2% target. In other words, the U.S. economy is not showing clear signs of recession, but inflation is not fully under control either. This combination makes it more difficult for the Fed to pivot quickly toward monetary easing.
In my view, the most important shift in the market right now is that investors are moving from asking, "How much growth can AI generate?" to asking, "How much profit can AI actually produce?"
In the past, investors were willing to assign premium valuations to chip orders, data center construction, and capital expenditure plans. Now, they want to know when those investments will translate into revenue, earnings, and free cash flow.
If companies continue to report solid revenue growth while capital expenditures climb and free cash flow comes under increasing pressure, their stocks could fall even when earnings growth remains positive.
This means the recent technology sell-off should not be dismissed as nothing more than a temporary bout of negative sentiment. It reflects both position adjustments and valuation compression, as well as a broader reassessment of earnings quality across the AI supply chain.
Over the next several weeks, growth stocks could recover if major technology companies demonstrate that AI is generating sustainable revenue without significantly weakening cash flow. On the other hand, even if AI demand continues to expand, valuations could remain under pressure if investment returns fail to materialize.
Major Financial Headlines Today
1. Intel's Outlook Triggers a Sharp Sell-Off Across Semiconductor Stocks
After reporting quarterly results on October 29, Intel issued revenue guidance for the following quarter that fell short of market expectations. The company also indicated that it would not achieve positive cash flow this year.
Investor concerns extend beyond the company's individual results. PC demand, memory costs, and the pressure that AI infrastructure spending is placing on industry resources are also weighing on sentiment.
On October 30, $INTC fell approximately 28.6%. $AMD and $NVDA dropped approximately 10.9% and 4.2%, respectively, while the semiconductor index declined about 7.2%.
This shows that investors are reassessing chipmakers' margins, cash flow, and future demand rather than simply buying into the long-term AI narrative.
2. Amazon's Cloud Business Delivers Strong Growth, but Massive Capital Spending Remains in Focus
Amazon reported third-quarter net sales of $201.9 billion, up 12% year over year. AWS revenue increased 39.3% year over year, reaching an annualized revenue run rate of $184 billion, while operating income came in at $28.1 billion.
At the same time, the company expects capital expenditures of approximately $220 billion in 2026.
This raises an important question for investors: AWS is growing rapidly, but can such massive infrastructure investments continue to translate into profits and cash flow?
For $AMZN, the market will be watching not only AWS growth but also returns on investment and changes in free cash flow.
3. Alphabet Reports Strong Cloud and AI Growth, but Its Stock Still Faces Selling Pressure
Alphabet reported third-quarter revenue of $127.6 billion, up 25% year over year. Google Cloud revenue surged 103% to $30.7 billion, with an operating margin of 31.8%.
Operationally, cloud computing and enterprise AI services delivered impressive growth.
However, the market remains concerned about the scale of AI infrastructure spending, future depreciation costs, and whether Google's search business can maintain its competitive advantage as AI products evolve rapidly.
For $GOOGL, revenue growth is encouraging, but investors still need to see whether AI investment can generate stable and sustainable profits.
4. Meta's Capital Spending and Free Cash Flow Deserve Attention
Meta reported third-quarter revenue of $64.6 billion, up 26% year over year. However, the company also disclosed approximately $34.9 billion in quarterly capital expenditures and negative free cash flow of $2.1 billion.
It's important to note that quarterly operating expenses included approximately $9.9 billion in legal settlement-related costs. Therefore, it would be inaccurate to attribute the entire change in net income to AI investment.
Nevertheless, the relationship between capital spending and cash flow is clearly a major concern for investors.
For $META, advertising growth provides an important source of funding. But if AI investment continues to expand, investors will demand stronger evidence that these expenditures can generate corresponding returns.
5. Microsoft's Results Show That Cloud Demand Remains Strong
Microsoft reported quarterly revenue of $92.3 billion, up 19% year over year, while operating income reached $45.9 billion, an increase of 21%.
These results suggest that demand for enterprise software, cloud computing, and AI-related services remains strong.
Microsoft must now demonstrate that AI commercialization can continue to drive Azure revenue and support overall profit margins.
For $MSFT, the key metrics going forward will be Azure growth, AI monetization, and returns on data center investment—not simply quarterly revenue growth.
6. Binance Security Incident Shakes the Cryptocurrency Market
On October 30, Reuters reported a major security incident involving Binance, with approximately $6.3 billion in assets affected. Bitcoin briefly fell toward $76,000, while Ethereum also weakened significantly.
It's important to note that reports have differed regarding the scope of affected assets, actual losses, and the amount subsequently recovered.
On October 31, Binance said it had used company funds to cover approximately $6 billion, while the remaining portion involved less liquid assets that were still being addressed.
The incident is another reminder that cryptocurrency risks extend beyond price volatility. Exchange security, custody arrangements, and liquidity risks are equally important.
7. Energy Stocks Hold Up Relatively Well, Supported by Results From Traditional Energy Companies
Exxon Mobil reported third-quarter adjusted earnings per share of $4.23, operating cash flow of $25.7 billion, and free cash flow of $19.1 billion. Chevron reported third-quarter adjusted earnings of $10.4 billion.
These results show why traditional energy companies with relatively clear cash flow and shareholder-return profiles may continue attracting investor interest when technology stocks come under pressure.
On October 30, the energy sector gained approximately 1.9%, making it one of the strongest-performing sectors of the day.
However, oil prices and energy stocks remain sensitive to geopolitical developments, supply-and-demand dynamics, and global economic expectations. A single day's gains should not be mistaken for confirmation of a long-term trend.
Bonds, Gold, Silver, and Market Sentiment
Turning to the bond and precious metals markets, the U.S. 10-year Treasury yield fell to approximately 4.93% on October 30, down around 0.06 percentage points from the previous day. This suggests that some capital moved toward relatively safer assets.
The U.S. Dollar Index stood at approximately 101.96. Gold futures settled at around $3,884.90 per ounce, down approximately 3.63% for the session.
As for silver, I have not found sufficiently reliable and consistent settlement data for October 30, so I will not provide an unverified price.
One detail worth noting is that Treasury yields declined while gold also sold off. This suggests that defensive positioning did not simply translate into a broad rush toward gold. Investors were still adjusting allocations across different asset classes.
In terms of market sentiment, the VIX volatility index rose approximately 12.9% to close at 19.42, indicating growing concern about short-term volatility.
However, this does not automatically signal systemic financial risk. The current environment looks more like a concentrated repricing of technology valuations, expected returns on AI investment, and corporate cash flow.
Sector performance also suggests that capital is moving away from high-valuation growth stocks and toward some industries with more stable cash flow. Whether this rotation continues will need to be confirmed over the next several trading sessions.
Investment Strategy: Don't Rush to Call the Bottom. Wait for the Market to Send a Signal.
Given the current market environment, is this the right time to buy the dip in technology stocks?
My view is that investors should not automatically treat consecutive declines as a low-risk buying opportunity.
Stocks such as $NVDA, $AMD, $INTC , and $AVGO remain exposed to long-term demand for AI computing. However, their near-term share prices will still be influenced by industry earnings expectations, capital spending, and valuation changes.
A more disciplined approach would be to wait for prices to stabilize, trading volume to gradually return toward normal levels, and key support areas to demonstrate meaningful buying interest before considering phased entries.
For $MSFT, $GOOGL, $AMZN, and $META, I am paying closer attention to cloud growth, AI product monetization, capital expenditures, and free cash flow.
These companies still have growth opportunities, but the market's expectations are becoming more demanding.
If revenue growth can cover infrastructure investment while margins and cash flow remain stable, valuations may find renewed support. But if capital spending continues to accelerate without a clear return, investors should become more cautious.
For short-term trading, I favor reducing exposure moderately, especially in highly volatile small-cap technology stocks and semiconductor-related names driven primarily by market sentiment.
Keeping some cash in your account does not mean giving up on opportunities. It gives you flexibility if the market continues to correct.
Don't rush into fully invested positions during a series of declines, and don't assume the trend has reversed simply because the market rebounds for one day.
Looking ahead, I see four areas worth monitoring:
AI and semiconductors: Focus on orders, gross margins, and cash flow rather than chip demand alone.
Cloud computing and data centers: Watch whether enterprise AI services are actually generating revenue.
Healthcare and utilities: These sectors may offer some defensive characteristics during periods of increased market volatility.
Energy: Monitor oil prices, corporate earnings, and capital returns.
In the U.S. Treasury market, yield movements will remain important because they influence growth-stock valuations. Gold and silver are also worth monitoring, but investors should avoid making directional decisions based solely on short-term safe-haven sentiment.
Several upcoming economic releases could influence market direction this week:
November 2: U.S. October ISM Manufacturing Index.
November 3: September Job Openings and Labor Turnover Survey (JOLTS).
November 4: ADP employment data and the ISM Services Index.
November 5: Preliminary third-quarter productivity and unit labor cost data.
November 6: October nonfarm payrolls report, the most important economic release of the week.
November 10: October CPI report.
Employment, wage, and inflation data will influence expectations for the Federal Reserve's next policy move and could become important catalysts for another round of growth-stock repricing.
If the market begins showing the following signals, I believe investors could consider gradually increasing their exposure to growth stocks:
The Nasdaq and semiconductor sector stop consistently making new short-term lows.
Rebounds are supported by stronger trading volume rather than relying solely on short covering.
Earnings guidance and cash flow from major technology companies support their capital spending plans.
Treasury yields avoid a sustained and rapid move higher.
Conversely, if employment and inflation data push rate expectations higher again, or major technology companies continue lowering their earnings outlooks, position management should take priority over chasing returns.
Closing Thoughts: Stay Patient and Keep Investing With a Long-Term Plan
In today's market briefing, we focused on the technology sell-off, returns on AI investment, Federal Reserve policy, corporate cash flow, and the key economic releases coming over the next several days.
My central message is this: Long-term opportunities still exist, but short-term uncertainty is increasing.
Don't lose confidence because of one major sell-off, but don't ignore the risks just because of a one-day rebound.
We continue to make steady progress on our retirement plans, aiming to turn our investment goals into reality through more disciplined asset allocation and long-term planning.
Our institutional accounts are also now open. Anyone interested is welcome to learn more and make a decision that suits their individual circumstances after fully understanding the associated risks and account rules.
We are also building a new investor community. Everyone is welcome to join the discussion, exchange trading strategies, and share the latest market developments.
Finally, I'd like to leave you with a reminder from Scripture:
"To everything there is a season, and a time to every purpose under the heaven."
There are times when markets rise and times when they correct. Some opportunities require patience, while some decisions require wisdom.
May we remain peaceful, patient, and disciplined through market volatility, without allowing short-term price movements to pull us away from our long-term plans.
Thank you for your attention today and for your continued trust and support. May the Lord grant you wisdom, peace, and blessings.
We'll meet again after today's U.S. market close to review market performance and discuss new opportunities and risks.
This is Market Insights. See you tomorrow.