Spot Buying Setup: Eyes on #SOL#Ecosystem Gems like #MYROUSDT Amid #BTC/#ETH Key Tests – 40%+ Upside Plays (1-5M Horizon)
Fellow traders, I've seen cycles where hesitation costs more than calculated entries. Right now, this window – and potentially next week – screams opportunistic spot accumulation.
We're hovering near pivotal supports: #BTCUSDT's rock-solid 98k monthly level and ETHUSDT's untested 3354 zone. These are the litmus tests for buyer conviction under any fresh selling pressure. If we hold, green lights all around; if not, brace for a dip to BTC 92k or ETH ~2900. But remember, bottoms are illusions until proven – DCA your stables into % allocations, build that spot/watchlist war chest, and stay nimble. No one's got a crystal ball to catch the buy the dips? That's the trader's edge.
Some thoughts about #BTC, #ETH and #SOL.
#SOLUSDT: (3 Months) https://t.co/1OTMBJDq7T
- Here, wait for a sweep of 144.85 and be ready to look into spot entry with target to the ATH.
#SOLUSDT (Monthly) https://t.co/4xAqtzbUJi
1) Test weekly OB, something around 130$ and then move to the ATH
2) Options in mind and leave some stables for this (low priority right now). Here we can see 95$ per #SOL and lower in case if BTC goes to the 92k.. but like I told before, leave only low % for this option. Need to see how this weekly chart closes on BTC.
Why do I think that #SOL and #SOL ecosystem can get top attention?
#SOLEHT (Weekly) https://t.co/5N3kfGww3M
- This chart shows that we can get performance from the SOL ecosystem this winter, want to bet for this. -
- Option 1 with Weekly FVG test looks good for me, that's why start looking for the SOL ecosystem altcoins.
#ETHUSDT: (Weekly) https://t.co/pn5dfAo2Xi
- Hope to see variant 1, right now building all plans and strategy based on it, but need keep in mind variants 2 and 3.
#ETHUSDT: (Monthly) https://t.co/hlOLAK1ZgJ
- Variant 1 looks best what we can get, test 0.5 global range with ~ 3100 and move to the 5k+...but also leave some % for the variant 2 with full-fill monthly FVG and deep test weekly FVG
#BTCUSDT: (Weekly) https://t.co/6yY383KtbV
- Also have 3 options in my mind:
1) where we just re-sweep 102k and move to the 130k+ (possible but not interesting as we left strong supports without tests)
2) best for me, here we test weekly and monthly FVG, #BTC can be ready to the ATH (in this case BTC.D can be 62%+ and possible start of altcoins season)
3) think no one ready for this after last dump and honestly, it can be surprise for all crypto markets. Here we will test all weekly and monthly supports, do first test of Yearly Open key level. Maybe in this variant BTC.D will do down and altcoins lose at least low % and not lose all)
Diving into the SOL ecosystem (shoutout to prior calls on #TRUMPUSDT and #JUPUSDT – already nibbling spot positions there), it's bubbling with asymmetric bets.
High-conviction alts primed for 200%+ pumps over 1-5 months?
Let's spotlight the next one on my radar: #MYROUSDT.
Entry Thesis on #MYROUSDT:
- Weekly Chart: Still coiling in that pristine Fair Value Gap (FVG) post-pump – classic imbalance screaming "fill me with buyers." Price action respecting higher lows, volume spiking on greens. Upside targets? 0.35-0.45 if SOL leads the charge and realistics around 0.044-0.08.
Weekly Chart: https://t.co/2LdoIAL0Oo
Daily Chart: Snapshot: https://t.co/bkRTC6LZ8N
- Inverted the short FVG from last month's bloodbath dump – that's liquidity magnet territory. Current daily FVG aligning perfectly for accumulation; we're at the lower edge, where smart money hunts value. OBV climbing, no exhaustion signals yet.
- Risk? Yep, we always can get -99% from invests.
- Reward? Serial higher highs eyeing 0.044-0.25+ short-term.
Plan: Deploying 25% of allocated size here at current levels for that FVG confluence.
Remaining 75% split across 2-3 laddered buys, scaling in on any market wobbles – behavior-dependent, always. This isn't moonshot gambling; it's probability stacking in a macro setup where SOL's DeFi/narrative tailwinds could 3-5x the board.
DYOR, manage risk like your portfolio depends on it (it does), and trade your plan. Not financial advice – just one vet's read on the tape.
#CryptoTrading #Altseason #SolanaEcosystem #MYROUSDT #BTCUSDT #ETHUSDT #TradingView #FVG #SpotTrading #CryptoGems #DeFi #DCA #Solana #Bitcoin #Ethereum #Altcoins #Memecoin #TechnicalAnalysis #Crypto #Trading #BullMarket #Jupiter #TrumpCoin #FairValueGap #OBV #MarketAnalysis #RiskManagement
🚨 Heads up, crypto fam! We've officially removed #TOKEN/USDT from our tracking list—no more support for this pair. Time to pivot your strategies! What's next on your watchlist? 📷👀 #Crypto#Cryptocurrency#Trading#Altcoin#USDT#DeFi#Blockchain#Web3#Bitcoin#Ethereum #Solana #Binance #Coinbase #DEX #CEX #Tokenomics #HODL #FOMO #DYOR #CryptoNews
https://t.co/gGudzyM5PL
Exciting News! Our FREE Forex Telegram groups are now OPEN and running 24/5! Join us for real-time trading alerts, market insights, and expert analysis to boost your trading game! Don't miss out—click the link to join now: https://t.co/SZF13pK45O
Join: https://t.co/vQbiRl9JS4
Join: https://t.co/uRdOjAaBAL
#ForexTrading #CryptoTrading #TradingSignals #ForexAlerts #JoinNow #FreeSignals #MarketAnalysis #TradeSmart
Discover the treasures awaiting you in our free Telegram group! 🌟 Imagine the exquisite insights and exclusive opportunities that await with our private alerts! 😎
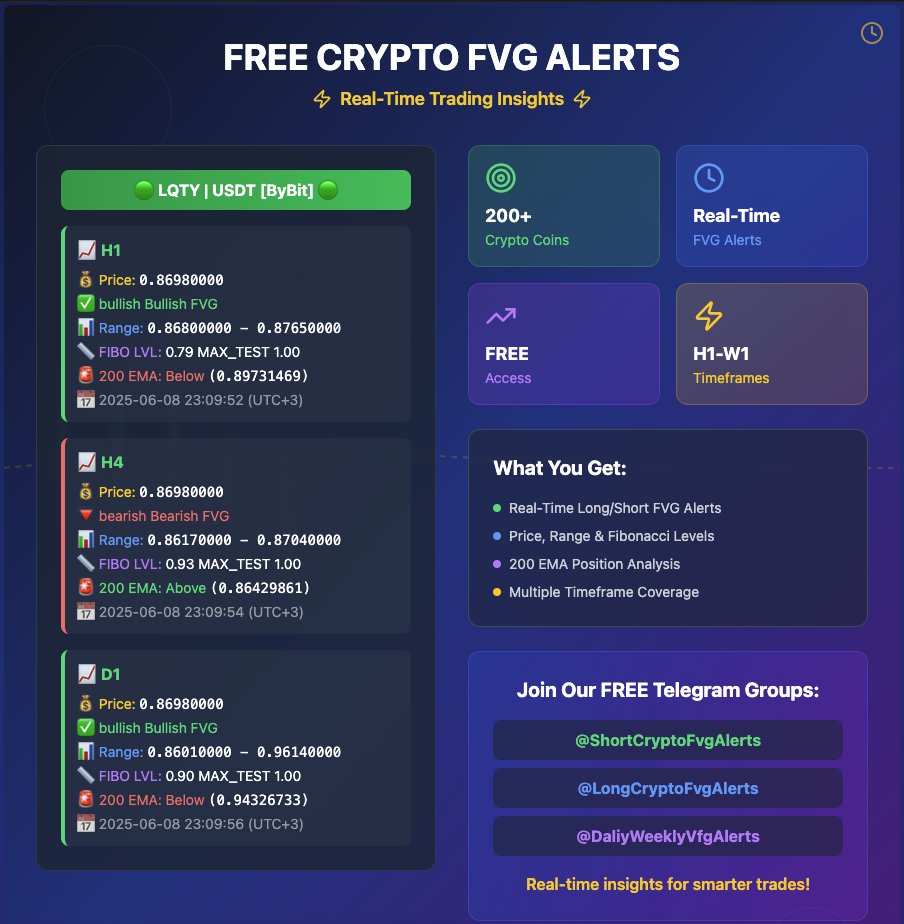
💡 Get real-time alerts for 200+ coins! Join:
https://t.co/yCvE9udNXu
https://t.co/FLn06QWne2
https://t.co/6fj557qjm6
#CryptoTrading #TechnicalAnalysis #SmartMoneyConcepts #SMCTrading
🚀 Master the 200 EMA in Crypto! 📷 Spot trends & trade smarter:
📷 Above 200 EMA: Buy bullish FVGs.
📷Below 200 EMA: Sell bearish FVGs.
📷 Get real-time alerts for 200+ coins! Join:
#CryptoTrading #TechnicalAnalysis #SmartMoneyConcepts #SMCTrading
- What is the 200 EMA?
The 200-period Exponential Moving Average (200 EMA) is a technical indicator that calculates the average price of a cryptocurrency (e.g., Bitcoin, Ethereum) over the last 200 periods (e.g., candles on a chart), giving more weight to recent prices compared to a Simple Moving Average (SMA).
This makes it more responsive to recent price changes while still capturing long-term trends.
- In Crypto:
The 200 EMA is widely used to identify the overall trend direction, support/resistance levels, and potential reversal points in volatile markets like Bitcoin (BTC) or Ethereum (ETH). It’s a favorite among traders because it smooths out price noise and highlights the market’s "big picture."
- Why It Matters:
In crypto’s high-volatility environment, the 200 EMA helps traders distinguish between noise and significant trend shifts, making it a versatile tool for both trend-following and counter-trend strategies.
- How the 200 EMA Works
Trend Identification:
Uptrend: Price above the 200 EMA suggests a bullish trend.
Downtrend: Price below the 200 EMA indicates a bearish trend.
- Support/Resistance:
The 200 EMA often acts as dynamic support in uptrends (price bounces off it) or resistance in downtrends (price struggles to break above).
- Timeframes:
* Daily (1D): The 200 EMA is popular for long-term trends (swing trading or investing).
* 4H/1H: Used for shorter-term trends or intraday trading, aligning with your account’s focus.
* 5M/15M: Less common but useful for scalping when combined with other indicators.
Best Ways to Use the 200 EMA in Crypto Trading
The 200 EMA is most effective when combined with other tools like FVGs, Fibonacci levels, or order blocks in Smart Money Concepts (SMC). Below are the best strategies for traders, tailored for crypto markets:
- Trend Confirmation:
* Use: Confirm the market’s trend before entering trades to avoid trading against the dominant direction.
* How:
If price is above the 200 EMA on a 1D or 4H chart, focus on long (buy) setups.
If price is below, prioritize short (sell) setups.
Example: On a 4H BTC/USD chart, if BTC is at $100,000 and above the 200 EMA ($95,000), look for bullish setups like FVGs near the 200 EMA.
Action: Use our Telegram groups to spot FVGs aligning with the 200 EMA for high-probability entries.
- Dynamic Support/Resistance:
Use: Trade bounces or rejections at the 200 EMA when it acts as support or resistance.
How:
Uptrend: When price retraces to the 200 EMA in a bullish market, look for buying opportunities, especially if the 200 EMA aligns with a bullish FVG or Fibonacci level (50%–61.8%).
Downtrend: When price rallies to the 200 EMA in a bearish market, consider shorting if a bearish FVG forms.
Example: On a 1H ETH/USD chart, ETH at $4,000 retraces to the 200 EMA ($3,800) with a bullish FVG ($3,780–$3,820). Buy with a stop below $3,780 (0.5% risk) and target $4,100 (2:1 RRR).
Action: Our analytics highlight when price tests the 200 EMA with FVGs, saving you time on chart analysis.
- EMA Crossovers with 50 EMA:
Use: Combine the 200 EMA with a faster EMA (e.g., 50 EMA) to identify trend reversals or continuations.
How:
Golden Cross: When the 50 EMA crosses above the 200 EMA, it signals a potential bullish trend. Look for long setups, especially with bullish FVGs.
Death Cross: When the 50 EMA crosses below the 200 EMA, it signals a bearish trend. Seek short setups with bearish FVGs.
Example: On a 4H BTC/USD chart, the 50 EMA crosses above the 200 EMA at $100,000, and a bullish FVG forms at $100,300–$100,600. Enter long with a stop at $100,200 and target $102,000.
Action: Our alerts notify you of FVG setups near EMA crossovers, enhancing trade timing.
- Confluence with FVGs and Fibonacci:
Use: Combine the 200 EMA with FVGs and Fibonacci levels for high-probability entries.
How:
Identify a bullish or bearish FVG (e.g., 0.5–2% in crypto, 5–20 pips in forex).
Draw Fibonacci from the swing low to high (bullish) or high to low (bearish), focusing on 50%–61.8% levels.
If the FVG, Fibonacci level, and 200 EMA align, it’s a strong trade setup.
- Example:
On a 15M BTC/USD chart, a bullish FVG forms at $100,200–$100,600, with the 61.8% Fibo at $100,570 and the 200 EMA at $100,500. Buy on a retest with a stop at $100,100 (0.4% risk) and target $101,500.
Action: Our Telegram groups provide real-time alerts when FVGs align with the 200 EMA and Fibonacci levels, streamlining your analysis.
- Risk Management with the 200 EMA:
Use: Set stop-losses and position sizes relative to the 200 EMA to manage risk.
How:
Place stops below the 200 EMA for longs or above for shorts (e.g., 0.2–1% risk per trade).
Trade only 5% of your account (e.g., $500 on $10,000) and cap daily losses at 2–3% ($10–$15).
Example: For a long at a bullish FVG ($100,600) near the 200 EMA ($100,500), set a stop at $100,400 (0.2% risk) to protect against false breakouts.
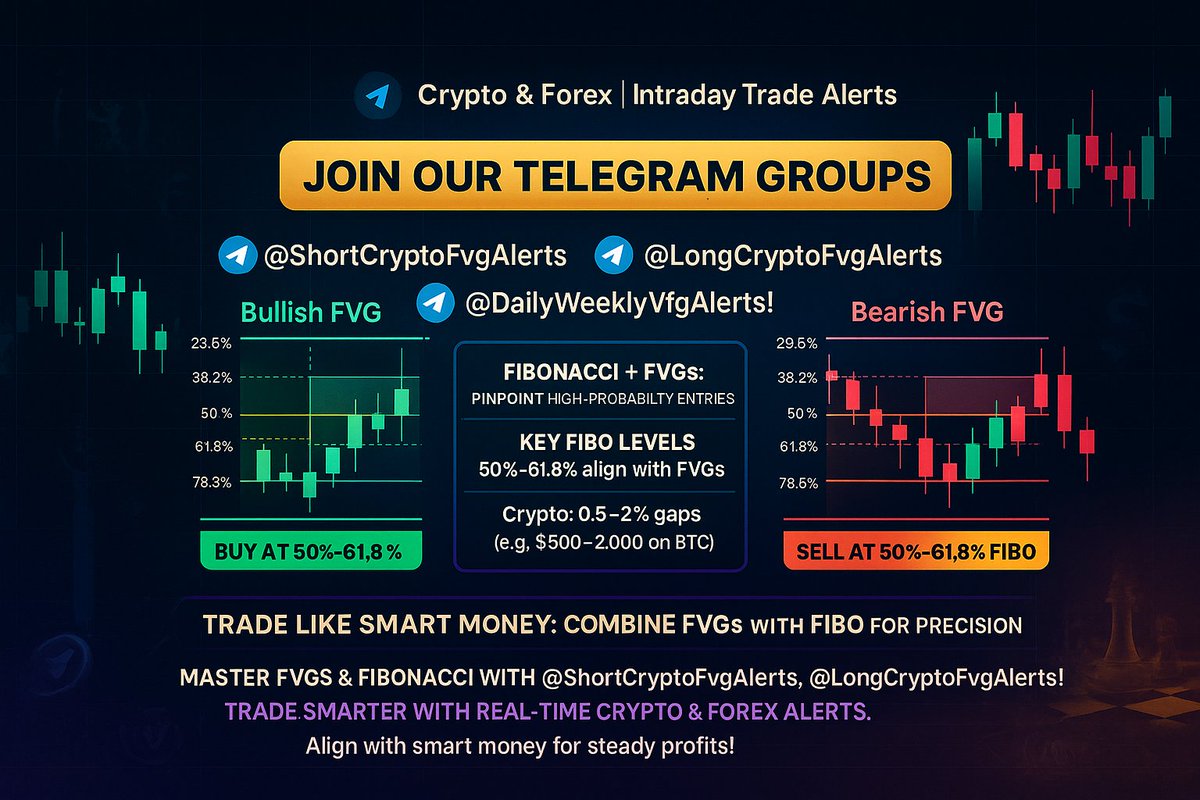
🚀 Unlock Fair Value Gaps (FVGs) with Fibonacci! 📷Spot high-probability trades:
📷 Bullish FVG: Buy at 50%-61.8% Fibo support after price gaps up.
📷Bearish FVG: Sell at 50%-61.8% Fibo resistance after gap down.
📷 Get real-time FVG alerts for 200+ coins! Join:
https://t.co/yCvE9udNXu
https://t.co/FLn06QWne2
https://t.co/6fj557qjm6
#CryptoTrading #SmartMoneyConcepts #TechnicalAnalysis #MarketStructure #SMCTrading
🚀 Master trading with Fair Value Gaps (FVGs)! 📷 Bullish FVGs signal buying opportunities; Bearish FVGs point to sells. Our analytics spot these for 200+ coins! Join our Free(see profile) and Private Telegram groups for real-time alerts.
What is a Fair Value Gap (FVG)?
A Fair Value Gap (FVG) is a price action pattern in Smart Money Concepts (SMC) that identifies an imbalance or inefficiency in the market where price moves rapidly, leaving a gap between candle wicks on a chart. This gap represents an area where buying or selling pressure was not fully absorbed, often due to institutional activity ("smart money").
FVGs are significant because they tend to act as magnets, drawing price back to fill the gap before continuing its trend, making them high-probability zones for trading.
For Beginners:
Think of an FVG as a "missing piece" in the price chart where the market skipped over certain levels too quickly. These gaps often get filled later, giving you a chance to enter trades when price returns to these levels.
For Experienced Traders:
FVGs are institutional footprints, revealing where smart money triggered aggressive buying or selling (e.g., liquidity grabs or stop hunts). They’re key to aligning with institutional order flow, often used with order blocks or breaker blocks for precise entries.
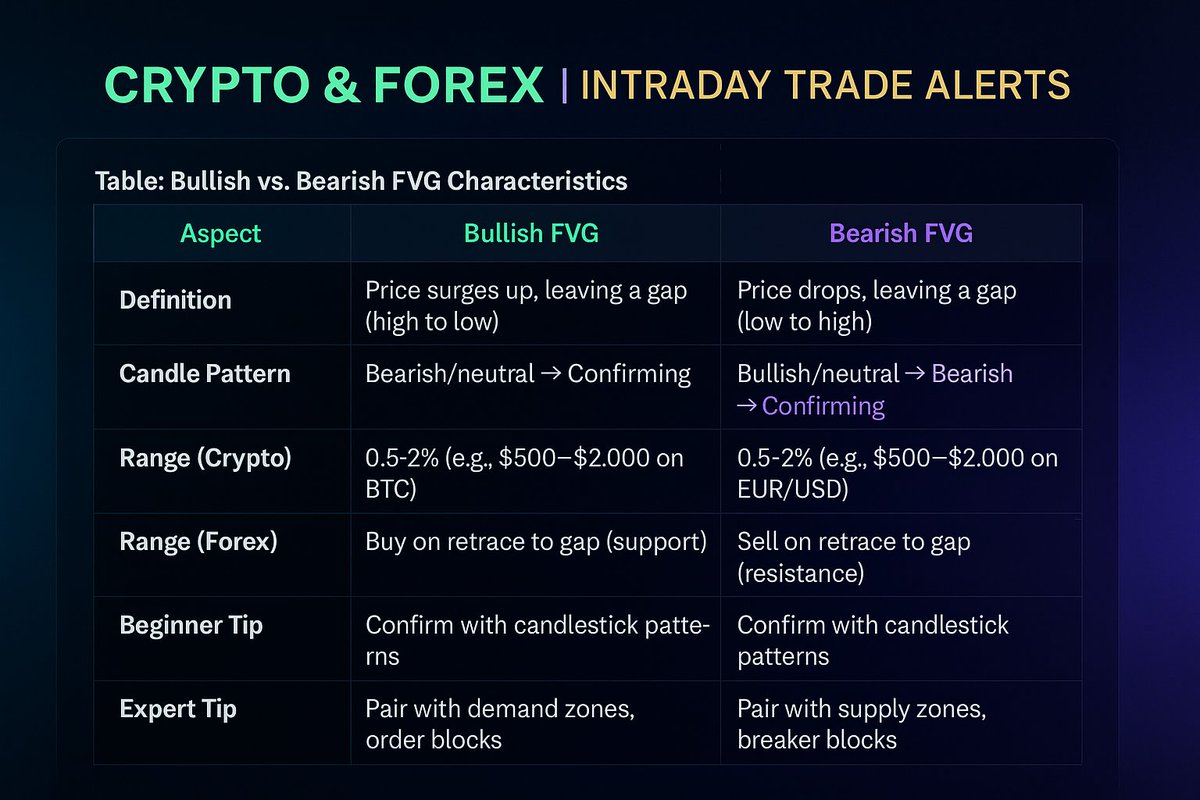
Bullish FVG
A Bullish FVG occurs when price surges upward rapidly, leaving a gap between the high of one candle and the low of a subsequent candle (typically on a 3-candle pattern). This gap indicates strong buying pressure, often from institutional buyers, and suggests an inefficiency that price may revisit before continuing upward.
How It Forms:
Candle 1: A bearish or neutral candle (sets the high).
Candle 2: A strong bullish candle that gaps up, leaving an untested price range.
Candle 3: A candle that doesn’t fill the gap, confirming the FVG.
The gap is the range between Candle 1’s high and Candle 3’s low.
Range for FVG:
In crypto and forex (e.g., BTC/USD or EUR/USD on 5M–1H timeframes):
Crypto: Typically 0.5–2% of the asset’s price (e.g., $500–$2,000 on BTC at $100,000).
Forex: Usually 5–20 pips (0.05–0.2% on major pairs like EUR/USD).
Smaller FVGs (0.5–1%) are common in high-liquidity markets; larger gaps (1–2%) occur during volatile moves (e.g., news events).
Trading Implication:
Beginners:
A bullish FVG signals a potential buying opportunity when price retraces to the gap (e.g., support zone). Wait for confirmation (e.g., candlestick patterns like a bullish engulfing) before entering a long position.
Experienced Traders: Use bullish FVGs with higher-timeframe order blocks or liquidity pools. For example, enter longs when price retraces to the FVG near a demand zone, targeting the next supply zone or unfilled gap. Combine with volume analysis to confirm institutional buying.
Bearish FVG
A Bearish FVG occurs when price drops rapidly downward, leaving a gap between the low of one candle and the high of a subsequent candle. This indicates strong selling pressure, often from institutional sellers, and suggests price may return to fill the gap before continuing downward.
How It Forms:
Candle 1: A bullish or neutral candle (sets the low).
Candle 2: A strong bearish candle that gaps down, creating an untested price range.
Candle 3: A candle that doesn’t fill the gap, confirming the FVG.
The gap is the range between Candle 1’s low and Candle 3’s high.
Range for FVG:
Crypto: 0.5–2% of the asset’s price (e.g., $500–$2,000 on BTC at $100,000).
Forex: 5–20 pips (0.05–0.2% on major pairs).
Larger gaps may form during high-impact events (e.g., central bank announcements).
Trading Implication:
Beginners: A bearish FVG is a potential selling opportunity when price retraces to the gap (e.g., resistance zone). Look for confirmation (e.g., bearish pin bar) before shorting.
Experienced Traders: Pair bearish FVGs with supply zones or breaker blocks. Enter shorts when price retests the FVG, targeting lower demand zones or liquidity pools. Use tools like Fibonacci retracements or volume spikes to validate institutional selling.
Key Characteristics of FVGs
Timeframes: FVGs are most effective on lower timeframes (5M–1H) for intraday trading, as used by your account (Crypto & Forex | Intraday Trade Alerts). Higher timeframes (4H–Daily) show stronger gaps for swing trading.
Range Specificity:
In crypto, FVGs of 0.5–1% are common during normal volatility; 1–2% during breakouts.
In forex, 5–10 pips is typical for majors, while 10–20 pips occurs in volatile pairs (e.g., GBP/JPY).
Gaps smaller than 0.2% (crypto) or 3 pips (forex) are often ignored, as they may not reflect significant institutional activity.
Smart Money Context: FVGs are often near key SMC structures like order blocks (areas of institutional buying/selling) or liquidity zones (stop-loss clusters). They signal where smart money has manipulated price to trap retail traders.
For Beginners
Why It Matters: FVGs simplify market analysis by highlighting where price is likely to return, reducing guesswork.
How to Use:
Wait for price to retrace to the FVG (support for bullish, resistance for bearish).
Confirm with simple patterns (e.g., double bottom for longs).
Set a stop-loss below/above the gap (0.2–1% risk) and aim for a 2:1 reward.
Test with prop firms (e.g., BreakoutProp) to practice without risking personal funds.
For Experienced Traders:
Why It Matters: FVGs reveal institutional intent, complementing your existing SMC knowledge. They’re high-probability zones for entries when aligned with order flow and market structure.
How to Use:
Identify FVGs near key levels (e.g., order blocks, breaker blocks, or mitigation blocks).
Use multi-timeframe analysis (e.g., 4H FVG confirmed by 15M entry).
Combine with liquidity concepts (e.g., stop hunts above/below FVGs) for precise targets.
Leverage our analytics to time entries during high-probability FVG retracements, saving analysis time.
Practical Example
Bullish FVG (Crypto):
On a 15M BTC/USD chart, price jumps from $100,000 to $101,000, leaving a 1% gap ($1,000) between $100,200 (Candle 1 high) and $101,200 (Candle 3 low). Price retraces to $100,600, near a demand zone. Enter a long with a stop at $100,100 (0.5% risk) and target $102,000 (2:1 RRR).
Bearish FVG (Forex):
On a 5M EUR/USD chart, price drops from 1.0800 to 1.0780, leaving a 10-pip gap between 1.0795 (Candle 1 low) and 1.0785 (Candle 3 high). Price retests 1.0790, near a supply zone. Short with a stop at 1.0805 (10 pips) and target 1.0765 (2:1 RRR).
Telegram Free Groups:
https://t.co/yCvE9udNXu
https://t.co/FLn06QWne2
https://t.co/6fj557qjm6
Telegram Private group 24/7 real-time analytics:
https://t.co/j9HL2b8yTQ
#SmartMoneyConcepts #CryptoTrading #MarketStructure #CryptoCommunity #TradingStrategy
🚀Telegram groups live! Get real-time crypto trading alerts with FVG tests
Join:
- Daily short: https://t.co/OsXPzQVx5g
- Daily Long: https://t.co/hyDBQYrQX8
- Daily & Weekly: https://t.co/I54ggjmNy7
This is just the start—stay tuned! #CryptoTrading#SmartMoneyMoves#MarketAlerts