US Unemployment Rate Actual 4.3% (Forecast 4.3%, Previous 4.3%)
US Labor Force Participation Actual 61.8% (Forecast 61.8%, Previous 61.8%)
US Average Workweek Hrs Actual 34.3 (Forecast 34.3, Previous 34.3)
US Average Earnings MoM Actual 0.3% (Forecast 0.3%, Previous 0.2%)
US Private Payrolls Actual 120k (Forecast 89k, Previous 123k)
US Manufacturing Payrolls Actual 7k (Forecast 2k, Previous -2k)
US Government Payrolls Actual 52k (Forecast -, Previous -8k)
US Average Earnings YoY Actual 3.4% (Forecast 3.4%, Previous 3.6%)
*US APRIL PCE PRICE INDEX RISES 0.4% M/M; EST. +0.5%
*US APRIL PCE PRICE INDEX RISES 3.8% Y/Y; EST. +3.8%
*US APRIL CORE PCE PRICE INDEX RISES 0.2% M/M; EST. +0.3%
*US APRIL CORE PCE PRICE INDEX RISES 3.3% Y/Y; EST. +3.3%
⚠️🔴 US PPI YoY Actual 6% (Forecast 4.8%, Previous 4.0%, Revised 4.3%)
US PPI MoM Actual 1.4% (Forecast 0.5%, Previous 0.5%, Revised 0.7%)
US Core PPI YoY Actual 5.2% (Forecast 4.3%, Previous 3.8%, Revised 4%)
US Core PPI MoM Actual 1% (Forecast 0.3%, Previous 0.1%, Revised 0.2%)
*US APRIL CONSUMER PRICES RISE 0.6% M/M; EST. +0.6%
*US APRIL CONSUMER PRICES RISE 3.8% Y/Y; EST. +3.7%
*US APRIL CORE CPI RISES 0.4% M/M; EST. +0.3%
*US APRIL CORE CPI RISES 2.8% Y/Y; EST. +2.7%
*US MARCH PCE PRICE INDEX RISES 0.7% M/M; EST. +0.7%
*US MARCH PCE PRICE INDEX RISES 3.5% Y/Y; EST. +3.5%
*US MARCH CORE PCE PRICE INDEX RISES 0.3% M/M; EST. +0.3%
*US MARCH CORE PCE PRICE INDEX RISES 3.2% Y/Y; EST. +3.2%
BREAKING: February PCE inflation, the Fed's preferred inflation measure, was unchanged at 2.8%, in-line expectations of 2.8%.
Core PCE inflation falls to 3.0%, in-line with expectations of 3.0%.
This marks the final pre-Iran War PCE inflation datapoint.
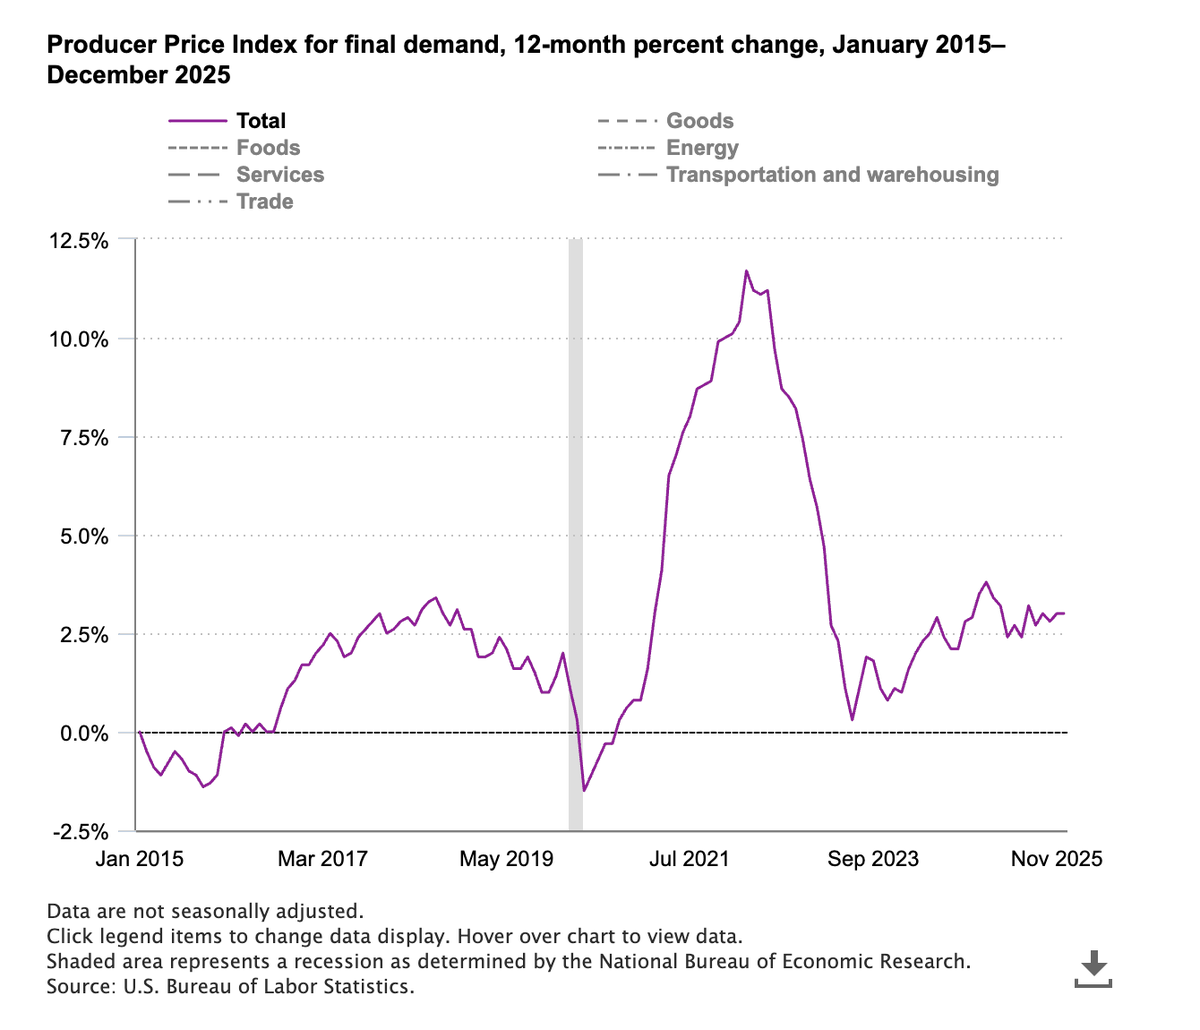
Today's Producer Price Index (PPI) release from the US Bureau of Labor Statistics (covering February 2026 data) shows a notable acceleration in wholesale-level inflation pressures.
- Headline PPI climbed to 3.4% YoY, the highest in 12 months, up from 2.9% prior month and above expectations of 2.9%.
- Core PPI (ex food/energy) accelerated to 3.9% YoY, up from 3.5% previous, the largest rise in three years and surpassing forecasts of 3.7%.
- The PPI for final demand rose 0.7% MoM, the largest monthly increase in seven months. Up from 0.5% previous month and far exceeding consensus expectations of 0.3%–0.5%,
- Core PPI MoM (final demand less foods, energy, and trade services) rose 0.5% MoM, down from the very high 0.8% in January, signaling mild easing in the more sticky inflationary pressures.
Looks like the PPI is responding quickly to global inflationary pressures from the oil shock and shipping constraints, indicating reacceleration in producer inflation, especially in goods (1.1%) and some select services (0.5%).
The sticky core components are more concerning amid high year-over-year Core PPI; however, month-over-month core PPI eased a bit from the prior month.
PPI (producer inflation) is usually a proxy for future CPI (consumer inflation), as most costs are passed on to consumers.
However, if consumers are weak, as we potentially indicated by recent consumer surveys, high consumer credit debt levels, and low consumer savings, it's possible that consumers will not accept the extra cost, leading to changes in consumer purchasing habits and further stagflationary trends.
*US JAN. PCE PRICE INDEX RISES 0.3% M/M; EST. +0.3%
*US JAN. CORE PCE PRICE INDEX RISES 0.4% M/M; EST. +0.4%
*US JAN. PERSONAL SPENDING RISES 0.4% M/M; EST. +0.3%
*US JAN. PERSONAL INCOME RISES 0.4% M/M; EST. +0.5%