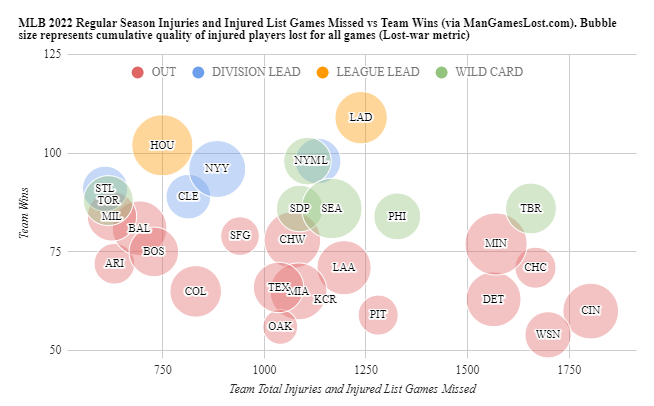
MLB 2022 regular season injury plot. Injuries and injured list games missed versus team wins. Bubble size represents cumulative quality of players lost for games (Lost-war metric)
https://t.co/Yh0kuFC1gD
MLB 2022 regular season, Top 5, impact on teams from injured players and IL (Lost-WAR metric)
1 MIN 10.06 WAR lost
2 HOU 9.43
3 SEA 9.04
4 MIA 7.04
5 NYY 7.03
https://t.co/Yh0kuFC1gD
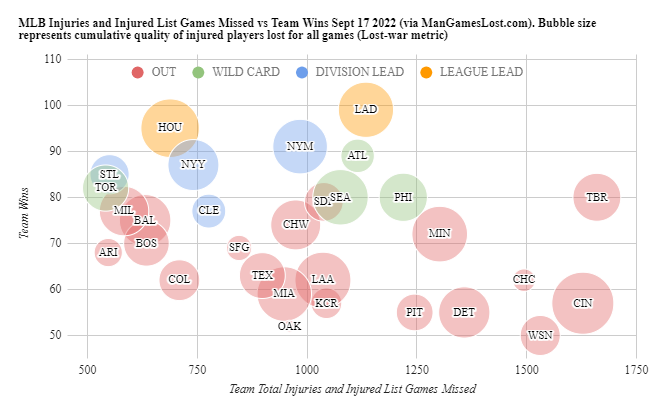
MLB injury plot. Injuries and injured list games missed versus team wins. Bubble size represents cumulative quality of players lost for games (Lost-war metric)
MLB injury plot. Injuries and injured list games missed versus team wins. Bubble size represents cumulative quality of players lost for games (Lost-war metric) https://t.co/52mgUSVq0m
MLB top 5, impact on teams from injured players and IL (Lost-WAR metric)
1 CIN 10.81 WAR lost
2 HOU 7.83
3 TBR 7.27
4 NYM 6.88
5 MIA 5.60
https://t.co/52mgUSVq0m
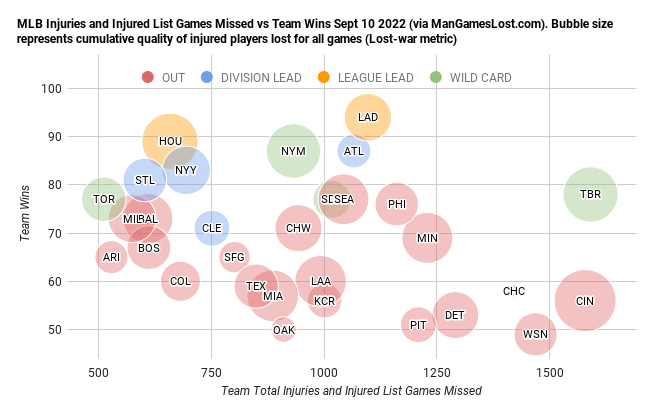
A few days late. For games through Aug 26th
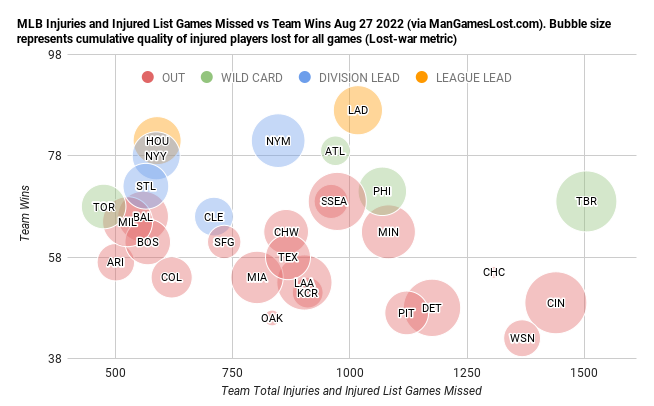
MLB injury plot. Injuries and injured list games missed versus team wins. Bubble size represents cumulative quality of players lost for games (Lost-war metric)
https://t.co/wMPdJhKnbj
A few days late. For games through Aug 26th
MLB top 5, impact on teams from injured players and IL (Lost-WAR metric)
1 CIN 8.96 WAR lost
2 TBR 8.51
3 SEA 7.17
4 DET 6.84
5 LAA 5.92
https://t.co/wMPdJhKnbj
A few days late. For games through Aug 26th
MLB bottom 5, games missed by injured players and IL
TOR 475
ARI 501
MIL 526
BAL 559
STL 565
https://t.co/wMPdJhKnbj
A few days late. For games through Aug 26th
MLB top 5, games missed by injured players and IL
TBR 1504
CIN 1439
WSN 1367
CHC 1307
DET 1175
https://t.co/wMPdJhKnbj
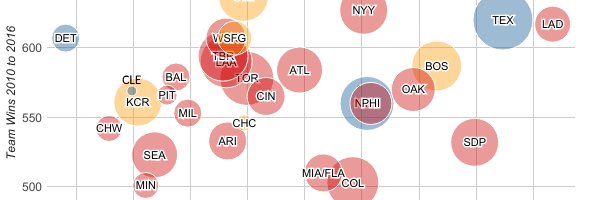
MLB top 5, impact on teams from injured players and IL (Lost-WAR metric)
1 TBR 7.51 WAR lost
2 LAA 7.05
3 SEA 6.76
4 CIN 6.28
5 PHI 5.90
https://t.co/hSRZPxuitj