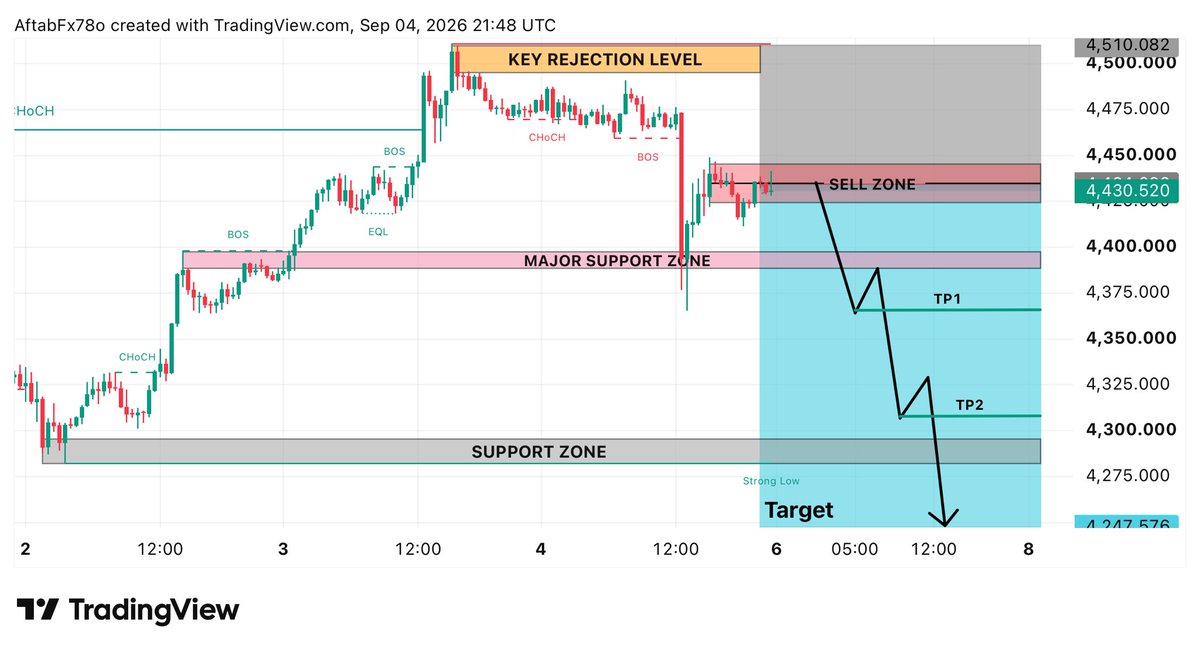
📊 MONDAY #GOLD SELL PLAN 📉
🔴 SELL ZONE: 4425–4445
🎯 TP1: 4365
🎯 TP2: 4305
🎯 FINAL TARGET: 4247
📌 REASON: Price is showing rejection from the upper sell area, while the overall structure remains bearish after the recent downside move. A clean rejection from the 4425–4445 Sell Zone can open the way toward the lower support levels.
⚠️ Wait for confirmation & manage your risk properly.
Stay disciplined. Stay patient. Trade the setup, not the emotions. ✅
#NZDUSD 🇳🇿/🇺🇸 Wave analysis of the pair within a 1-day timeframe ⏳
Continuation pattern 🔄
Observations:
The price completed an upward wave, appearing as a zigzag pattern and labeled as wave (W) 🌊.
This was followed by a sideways movement, which is likely to develop into a triangle pattern 🔀, supporting the bullish outlook 🚀.
It remains to be confirmed whether all the waves of this pattern are complete.
Forecast:
If the price breaks through a key level of this pattern, coinciding with a breakout of the upper boundary of the triangle, this would confirm the expected upward movement 📈.
The ideal target for wave (Y) is at the level of 0.64501 🎯.
This movement is likely to occur within an upward wave of a larger corrective pattern.
...To analyze our educational program 👉:
https://t.co/CRUph7e5PO
#EURUSD #ElliottWaves #PriceActionTrading #PriceAction #PriceActionStrategy #CurrencyTrading #TechnicalAnalysis #TradingForLives #TradingAcademy #TradingStrategies #TradingProfits #TradingExpert #TradingForLives #ForexSchool #ForexAsia #ForexDubai #ForexEurope #ForexUK #ForexMalaysia #ForexAustralia #ForexSpain #ForexFrance #ForexJapan #ElliottWaves #WaveAnalysis #GoldTrading #PriceActionTrading #XAUUSD #DowJones #ForexUK
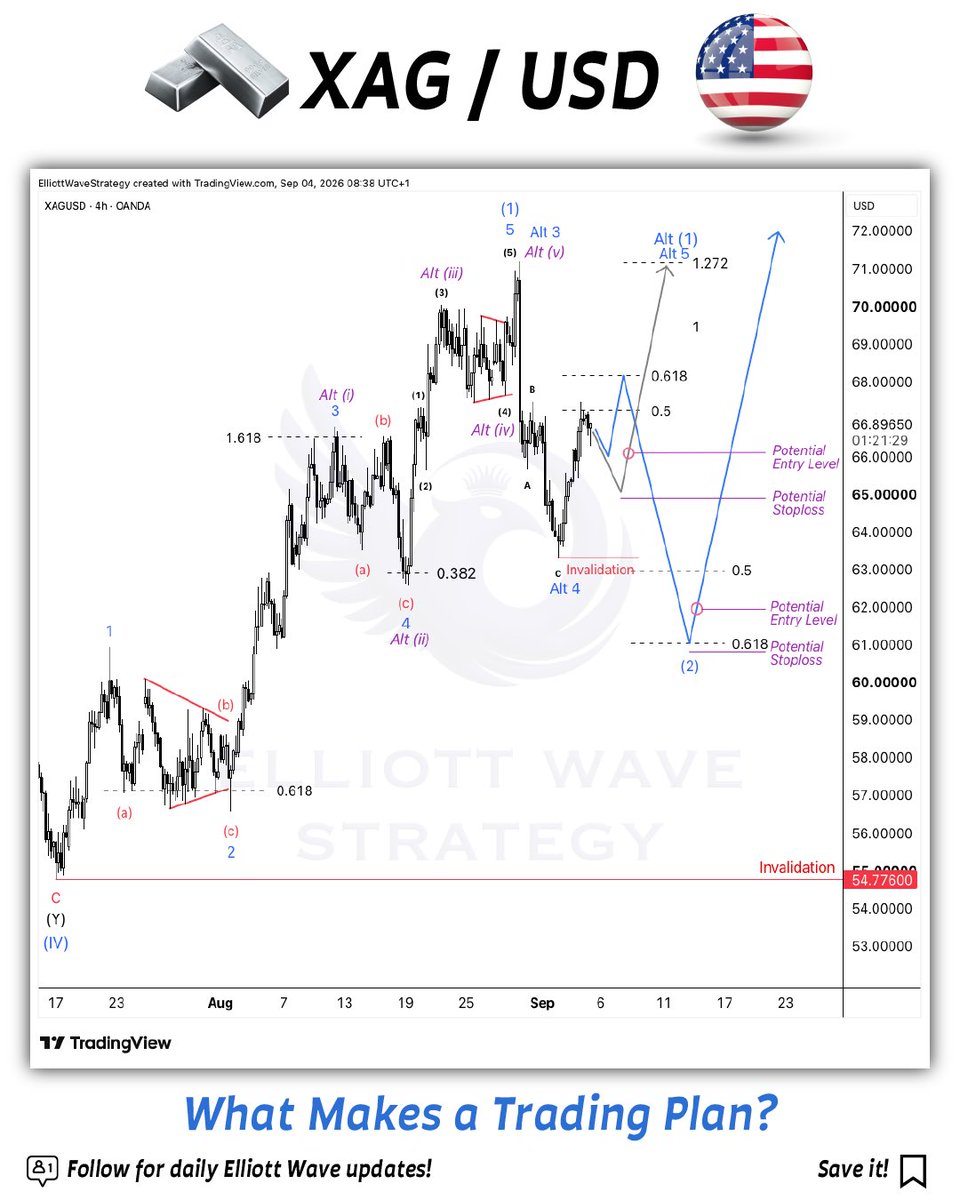
#XAGUSD
You don't need to be right every time. You need to know what to do when you are wrong.
This is how we approach a setup.
We first map the possible scenarios, then define where an entry could make sense, where the risk should be managed and what level would invalidate the idea.
On XAGUSD, we have two possible paths. Both have their own entry and stop areas.
The important part is not predicting which one will happen with 100% accuracy.
The important part is having a plan for both.
A stop loss is not a failure. It is part of trading.
We don't try to avoid every loss. We try to keep the losses controlled when a scenario doesn't work.
Plan the trade before the trade starts!
STRATEGI TRADING MENGGUNAKAN DOUBLE MOVING AVERAGE
Ini saya diajarin sama suhunya crypto trader Bandung: @skyarly
Strateginya simple banget dan bisa digunakan buat crypto dan XAU
(yang lain mungkin bisa tapi belum saya coba)
SIMAK YA
Caranya sebenarnya sederhana
Kita perlu 2 timeframe:
- Buat swing trading: TF 1D dan 4H
- Buat day trading: TF 1H dan 15m
Lalu kita pilih moving average yang mau kita pake. Baik jenisnya, maupun angkanya.
Saya pribadi kebiasa pake EMA
Angkanya bisa:
- Kecil: 5 atau 8
- Sedang: 18, 20, 21, 25, atau 34
- Besar: 50, 100, 200
Simplenya:
Makin besar angka, makin jarang dapet setup, tapi makin gacor kalau cuan karena nangkep pergerakan besar
For the sake of simplicity, saya gunakan EMA 21 aja buat day trading ya
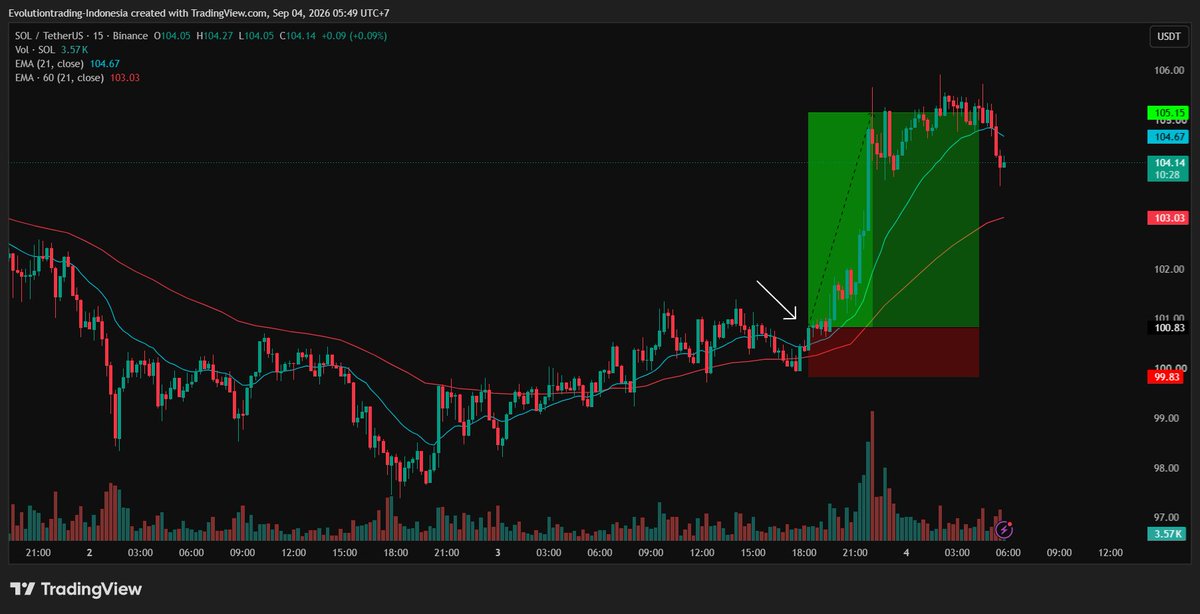
Kita buka chart 15 menit, lalu masukkan indikator EMA 2 kali.
Dua-duanya sama-sama kasih angka 21, yang satu kasih warna merah, 1 kasih warna biru
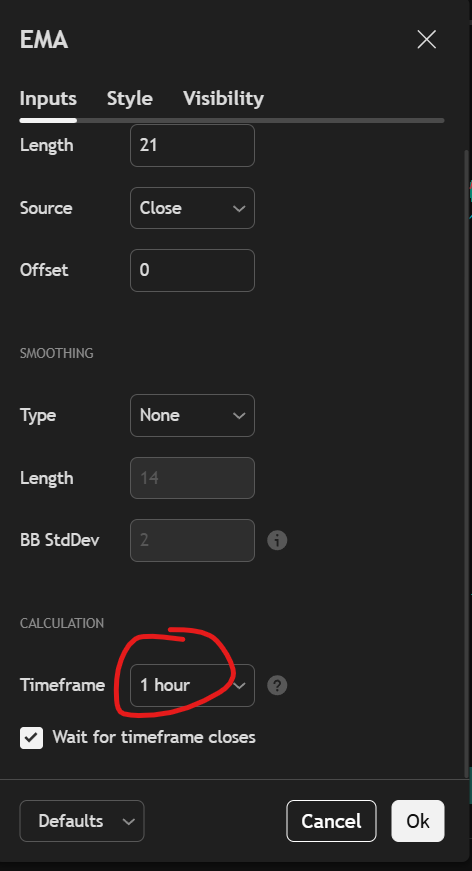
Di garis EMA yang merah, kalian ke setting, lalu di input, ganti timeframe jadi 1 HOUR
Nah, nanti si garis EMA bakal menunjukkan garis di timeframe 1 jam walau lagi buka chart 15 menit
Jadi kita punya EMA biru (buat timeframe 15 menit) dan EMA merah (buat timeframe 1 jam)
Gini caranya:
JIKA HARGA BERADA DI ATAS EMA MERAH = CARI POSISI LONG
JIKA HARGA BERADA DI BAWAH EMA MERAH = CARI POSISI SHORT
CARA ENTRY - LONG POSITION
1. Pastikan dulu harga berada di atas EMA merah
2. Masuk kalau harga breakout dari EMA biru
3. Stop loss sedikit di bawah EMA merah atau low terakhir sebelum breakout
4. Cari 2R buat profit, atau exit jika harga breakdown EMA merah
CARA ENTRY - SHORT POSITION
1. Pastikan dulu harga berada di bawah EMA merah
2. Masuk kalau harga breakdown dari EMA biru
3. Stop loss sedikit di atas EMA merah atau high terakhir sebelum breakdown
4. Cari 2R buat profit, atau exit jika harga breakout EMA merah
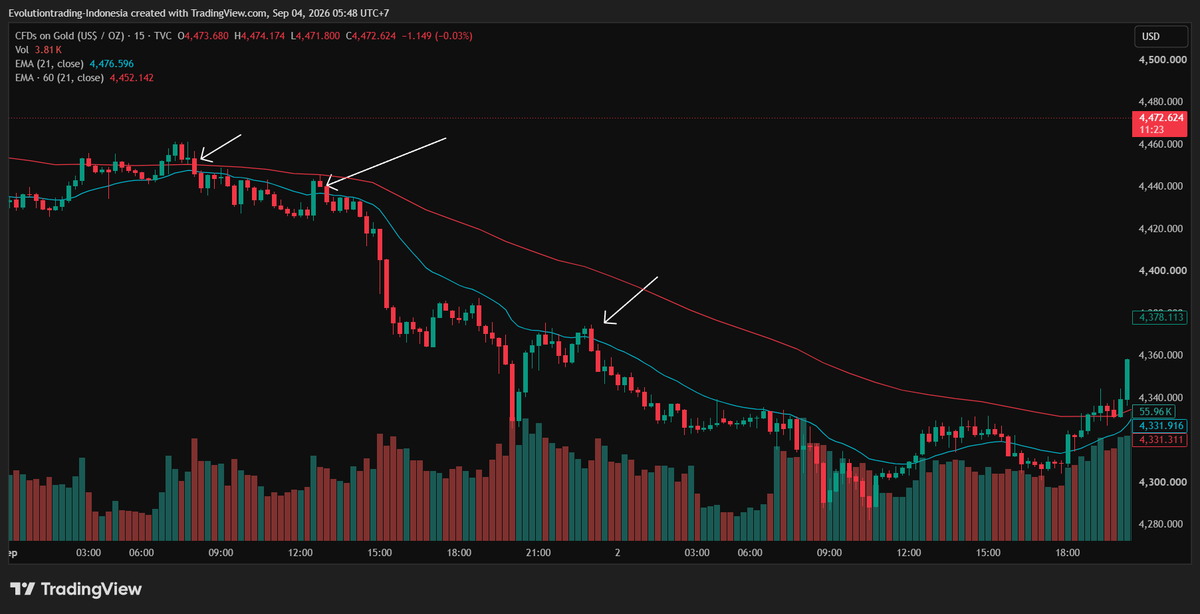
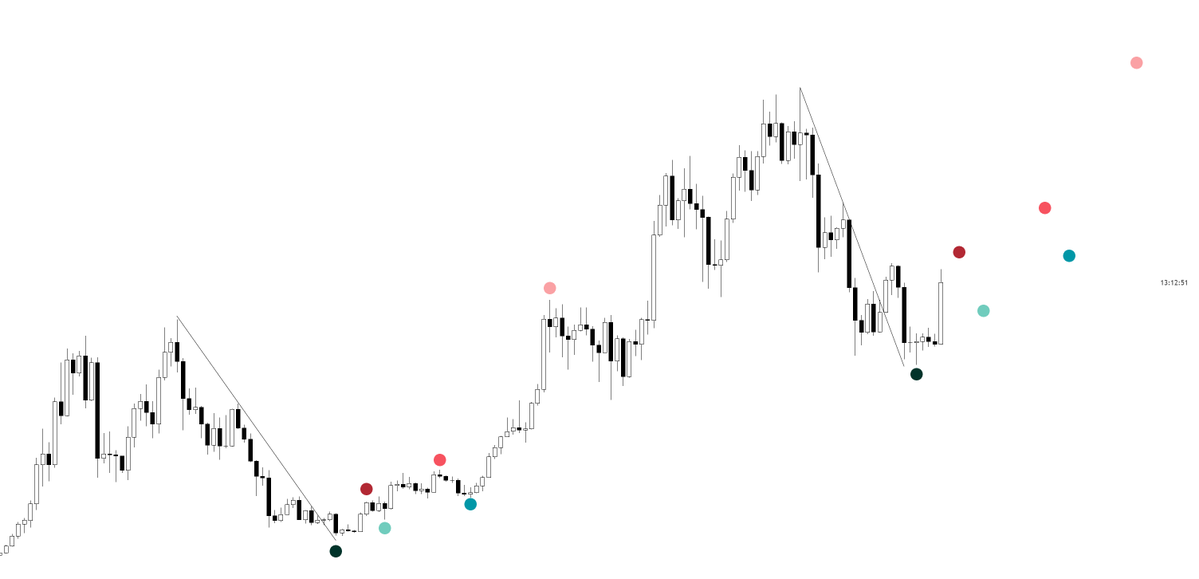
Contoh: BITCOIN
(per saya nulis ini, masih bisa hold...atau kalau mau exit ya bebas)
Contoh lainnya: XAU dan Solana
🚨 BİZ BİR SONRAKİ BÜYÜK HAREKETİ YAPMAK ÜZEREYİZ
Henüz neredeyse kimse bizi izlemiyor.
4.500 dolar civarında ALTIN'ı açığa sattık → 4.000 dolar civarında kapattık
Sonra 4.000 dolarda UZUN pozisyona çevirdi → 4.400 dolar civarında sattık.
Şimdi tekrar başlıyoruz.
Ve bu sefer, hem ALTIN hem de GÜMÜŞ'te BÜYÜK bir pozisyon almaya hazırlanıyoruz.
Tam alım seviyelerini yorumlardaki telegramda paylaşıyoruz.
Geçen döngüde, 90 dolar civarında ETH aldık ve sonunda tüm pozisyonumuzu 4.000 dolar civarında sattık.
Bir çok büyük trader bizi takip ediyor.
Bu seviyeleri ÇOK yakından izliyoruz.
Bu grafiği kaydedin.
Bitcoin, Altın ve Gümüş giriş noktalarımıza denk gelirse, işler çok hızlı bir şekilde çok ilginç bir hal alabilir.
Ücretsiz işlemler telegram özel grubumuzda paylaşılıyor.
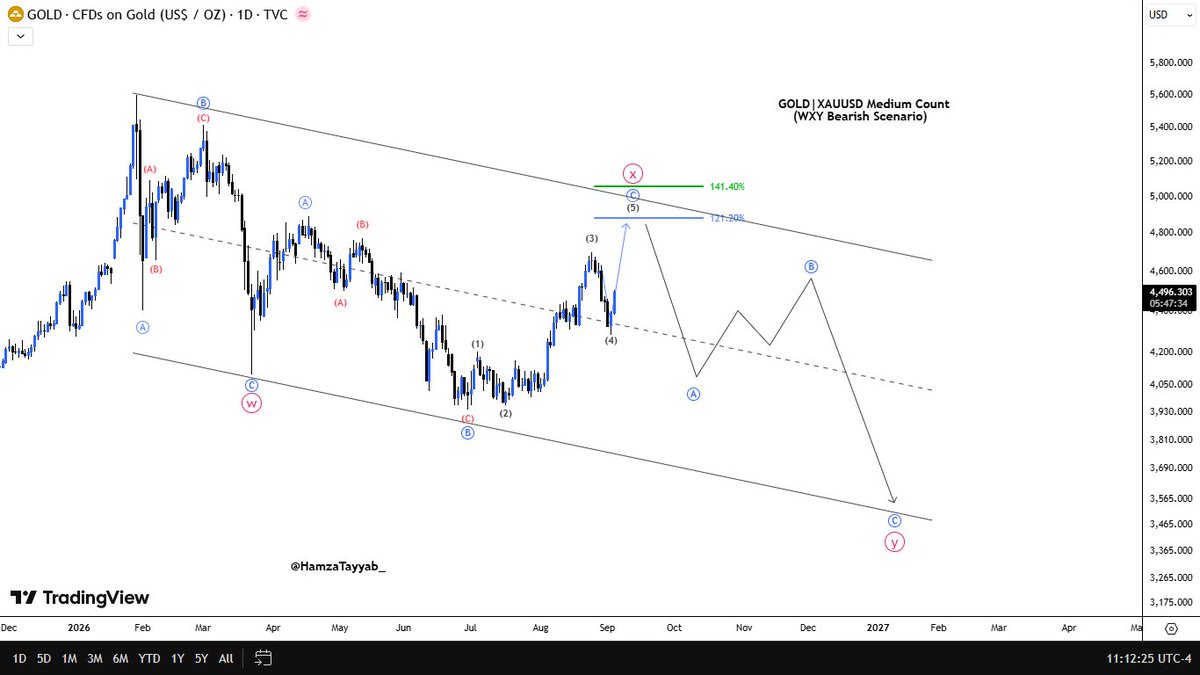
#GOLD|XAUUSD
Medium-Term Count:
If we get one more high, I expect it to come from the current area.
However, if price starts falling from here, the top is likely already in, and the bearish scenario would target 3,500.
#XAU
$XAUUSD #Gold update
Price came down nicely in five waves and then perfectly stopped and stabilized around the 4,300.
It now seems that we have a new impulsive recovery, but keep in mind that this could be only the first leg of a minimum three-wave rise.
So the current rebound could extend further after some setback, with wave B support around 4,360–4,400. On the upside, an important area to watch comes in around 4,570.
#elliottwave
$NQ Daily Bias Hit ✅
Price delivered IRL → ERL exactly as expected.
Daily FVG held as the key area, and price respected the bearish bias before pushing lower.
Bias → Confirmed
IRL → ERL → Delivered
Now watching for the next clean structure and liquidity setup.
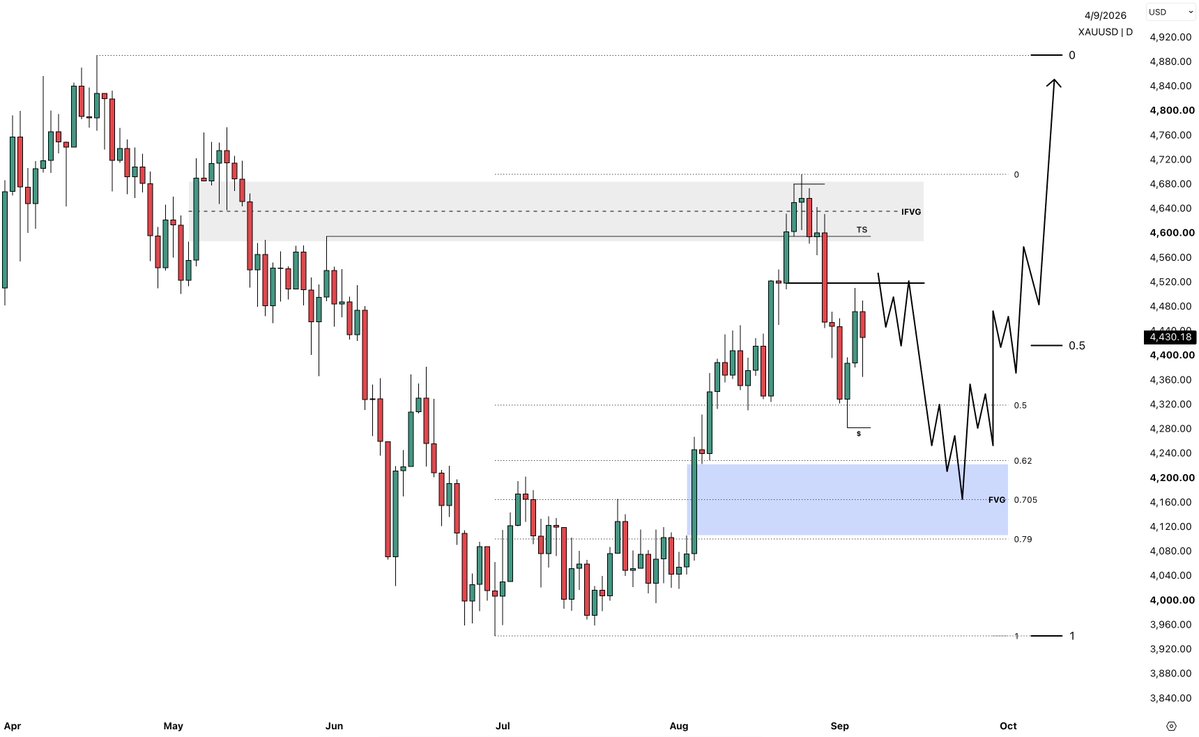
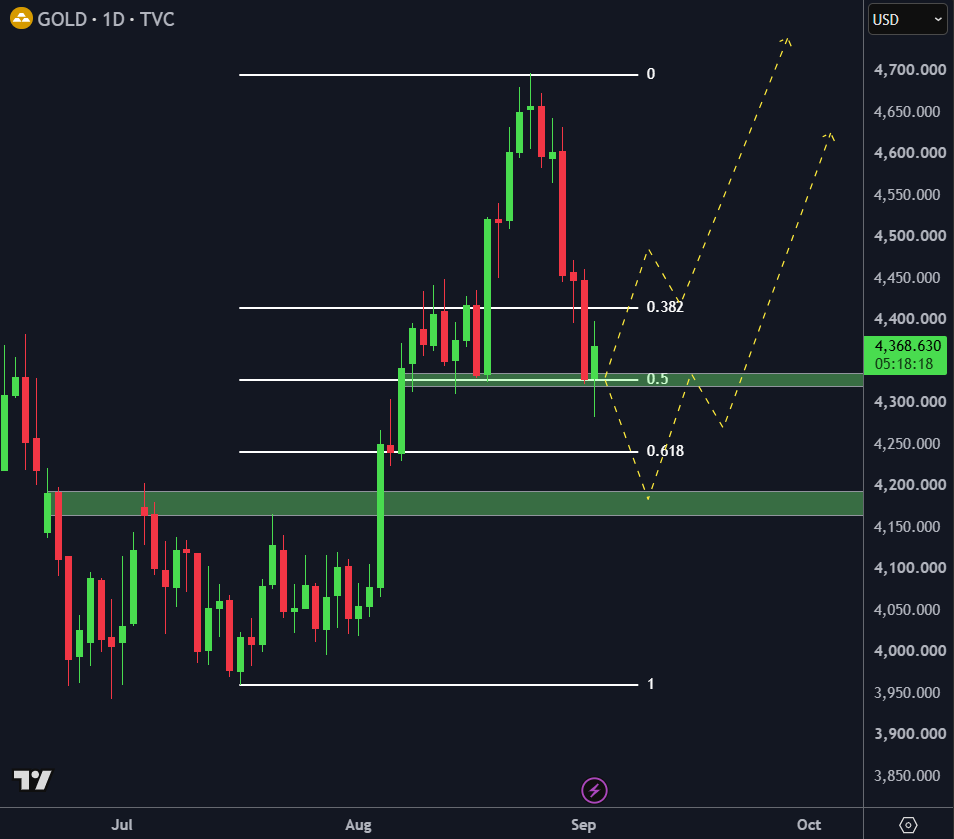
Gold Daily Chart:
Price showing a bit of resilience here at the 50% retracement zone.
Macro wise, I still think the bull case holds. Weaker economic data than forecasts had expected, jobs data soft this week ahead of NFP, and an administration committed to trying to keep long term bond yields down are a solid bull case in my view.
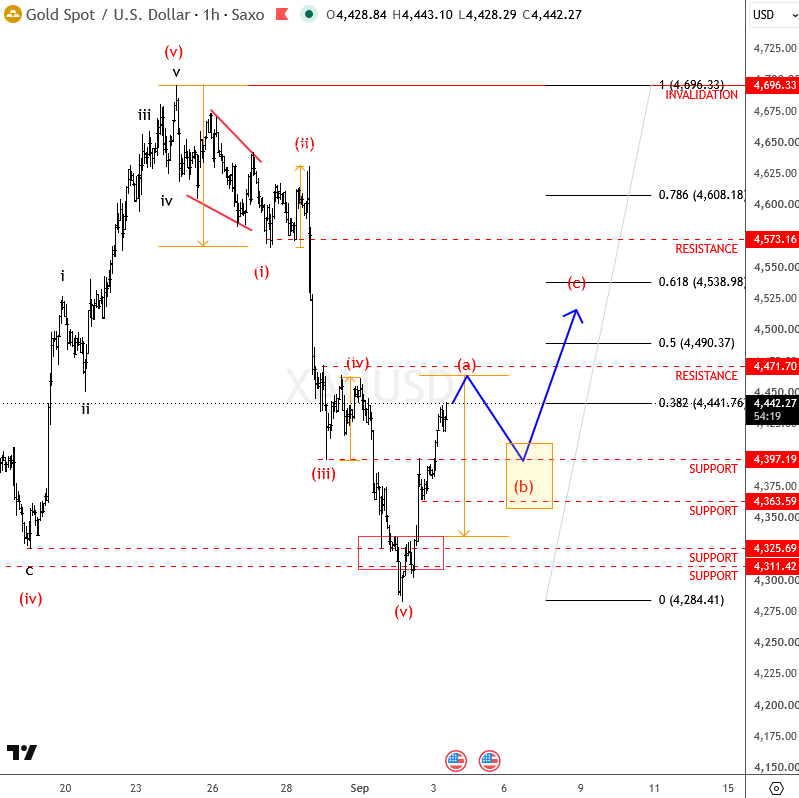
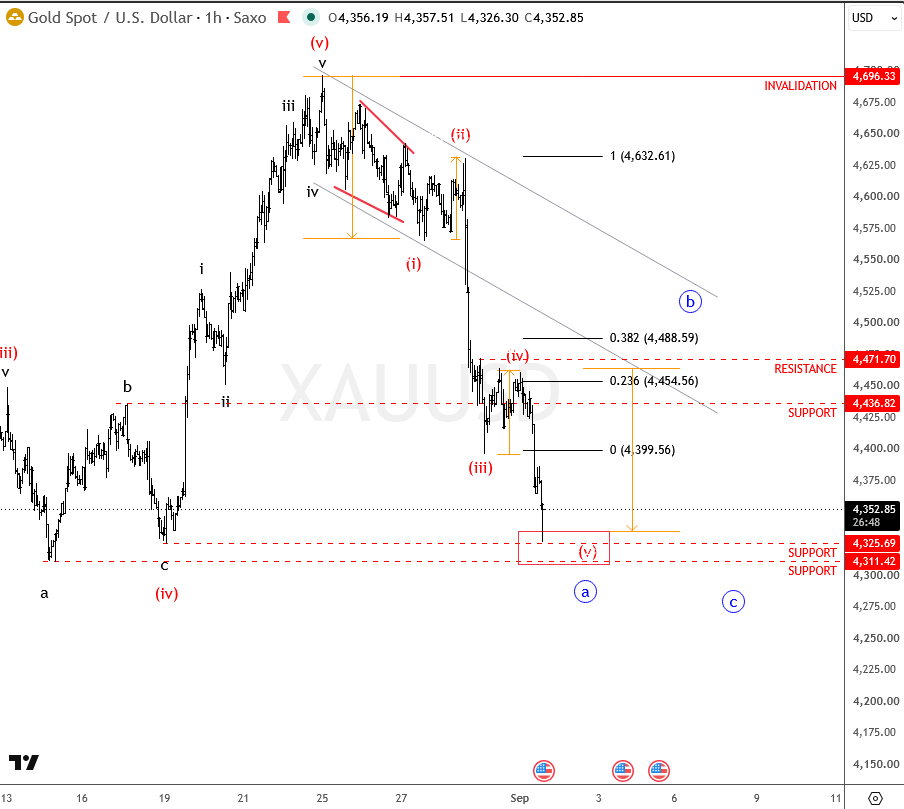
$XAUUSD update
With new intraday low, Gold comes lower in five waves from 4700, confirming the idea of a deeper, higher-degree pullback.
Some support now at 4300, but rebound from there likely be part of that ongoing a-b-c structure.
#xagusd#gold#Elliottwave
#XAUUSD Bu grafikte ana senaryomuzu değiştirmiyoruz. Altın tarafında son yükselişi, ana düşüş yapısı içerisinde tamamlanmaya yaklaşan bir düzeltme hareketi olarak değerlendiriyoruz. Fiyatın yeniden uzun vadeli düşen kanalın üst bandından satışla karşılaşması ve 4.886 bölgesinin altında kalmaya devam etmesi, teknik açıdan aşağı yönlü senaryoyu masada tutuyor. Elliott tarafında da mevcut yapının tamamlanmasının ardından Y dalgası içerisinde 4.050–3.800 ve kanal alt bandına denk gelen 3.700–3.750 bölgesine doğru daha sert bir fiyatlama görme ihtimalini takip ediyoruz.
Temel tarafta da bu senaryoyu destekleyen önemli gelişmeler var. Fed Başkanı Kevin Warsh’ın Jackson Hole’daki şahin mesajlarının ardından piyasa Eylül ayında faiz artırımı olasılığını %60’ın üzerine taşırken, ABD 2 yıllık ve 10 yıllık tahvil faizleri yeniden yükselişe geçti; 10 yıllık getiri bugün yaklaşık %4,73 seviyesinde. Yüksek reel faiz ve güçlü faiz beklentisi, faiz getirisi olmayan altın açısından önemli bir baskı unsuru. Barclays de Warsh sonrası tahminini değiştirerek 2026 içerisinde iki adet 25 baz puanlık faiz artışı beklemeye başladı.
Jeopolitik tarafta ABD–İran geriliminin yeniden yükselmesi ilk bakışta altın için pozitif görünse de, petrol fiyatlarının tekrar yükselmesi enflasyon riskini artırıyor ve bu kez piyasada “güvenli liman alımı”ndan çok “Fed daha uzun süre sıkı kalacak” fiyatlaması öne çıkıyor. Nitekim altın bugün iki haftanın en düşük seviyelerine yaklaşırken, yükselen petrol ve Warsh’ın şahin duruşu baskının ana gerekçeleri arasında gösteriliyor.
Özetle: 4.886 üzeri kalıcı fiyatlama gelmediği sürece ana senaryomuz değişmiyor. Kısa vadeli tepki yükselişleri mümkün olsa da, teknik yapı ile birlikte yükselen ABD tahvil faizleri ve yeniden güçlenen faiz artırım beklentileri bize önümüzdeki dönemde altın tarafında aşağı yönlü daha büyük bir hareketin henüz tamamlanmamış olabileceğini düşündürüyor. Senaryo çalışmasıdır; kesinlik içermez.
$GOLD Update
The move extended, Structure likely morphed into a running flat as a connector wave X. Outlook remains bearish.
Wave W parity lies at 3440
The rally was just for exit liquidity. Stay safe
🚨 GOLD JUST FIRED A WARNING THAT COULD BREAK THIS ENTIRE MARKET
Forget the gold dump.
What it may be signaling next is far more dangerous.
I warned about the gold selloff before it happened. Now the setup behind it is starting to spread into the one place nobody wants to question:
AI stocks.
The chain is brutal:
War → Oil → Inflation → Higher yields → Gold gets crushed → Cost of capital stays high → AI valuations crack.
The Iran conflict disrupted energy flows and pushed oil higher.
Higher oil keeps inflation alive.
Sticky inflation gives the Fed less room to cut.
Less cutting keeps real yields elevated.
And elevated real yields are exactly what an overheated, non-yielding asset like gold does NOT want.
But here's the part almost everyone is missing:
Money isn't rotating from gold into risk.
Retail is hiding in cash and short-duration Treasuries.
That matters.
People buy gold when they're scared about tomorrow.
They sell gold when they need safety today.
And if rates stay higher for longer, this stops being a gold problem.
It becomes an equity valuation problem.
The market is insanely concentrated in a handful of AI names priced for years of future growth.
Higher discount rates destroy the value of those distant cash flows.
Suddenly the market stops paying for the story and starts asking one question:
Where's the cash?
That's when the AI trade gets vulnerable.
That's when concentration becomes a liability.
That's when the same rates that broke gold start hitting everything priced for perfection.
Gold may have been the first domino.
I called the gold dump before it happened.
Now I'm watching what comes next.
Because if this chain keeps moving, the gold selloff will be the part everyone wishes they had paid attention to.
Turn notifications on.
The next domino is bigger.
#GBPCHF 🇬🇧/🇨🇭 | 📊 Expected wave pattern for the pair within the daily timeframe.
🌊 Opportunity to ride an upward wave.
The price appears to be preparing for a strong breakout, as it has broken through a key price channel. This could indicate the formation of wave (5) of the third wave, potentially reaching the 161.8% level, and possibly extending further, suggesting an upcoming bullish wave.
💡 Any downward correction would present a good opportunity for re-entry, with targets at levels 1.11146 - 1.12716. We could potentially reach even higher levels if the positive momentum continues.
It is crucial to maintain the bullish scenario by continuing to trade above the price channel. This could reinforce the bullish outlook, and avoiding overlap between waves 1 and 4 is also important.
...To analyze our educational program 👉:
https://t.co/CRUph7e5PO
#EURUSD #ElliottWaves #PriceActionTrading #PriceAction #PriceActionStrategy #CurrencyTrading #TechnicalAnalysis #TradingForLives #TradingAcademy #TradingStrategies #TradingProfits #TradingExpert #TradingForLives #ForexSchool #ForexAsia #ForexDubai #ForexEurope #ForexUK #ForexMalaysia #ForexAustralia #ForexSpain #ForexFrance #ForexJapan #ElliottWaves #WaveAnalysis #GoldTrading #PriceActionTrading #XAUUSD #DowJones #ForexUK