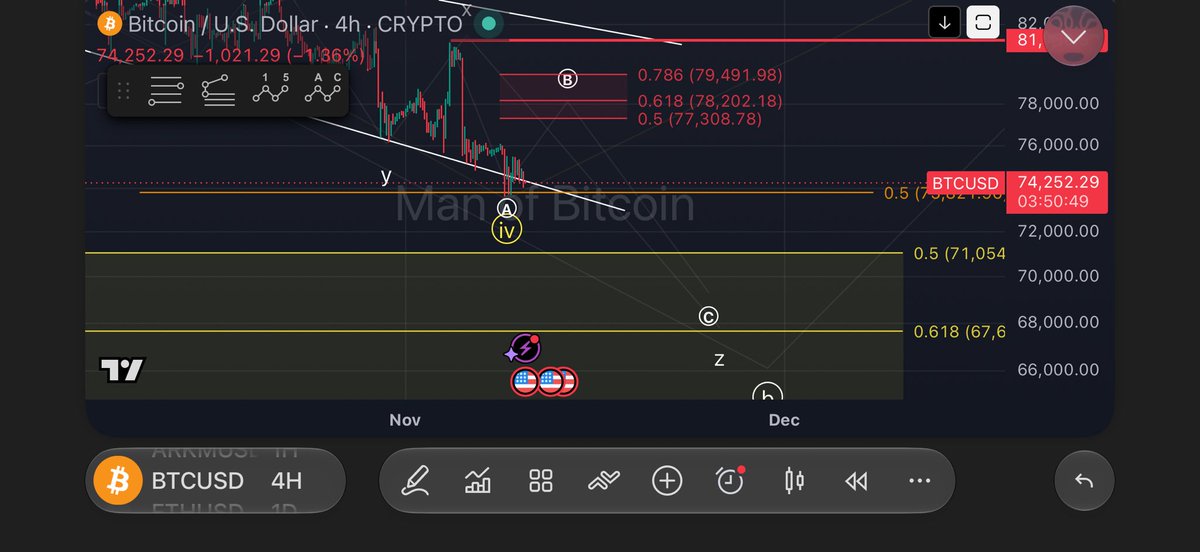
$BTC has broken above the descending trendline but is moving higher in a corrective pattern.
As long as we don't see an impulsive move to the upside, I assume wave-(2) is unfolding, with key resistance at $81,075.
$BTC: a break above the descending trendline would be the first sign of a local low.
Key resistance is located at $81,180.
As long as the price remains below this level, I expect lower prices.
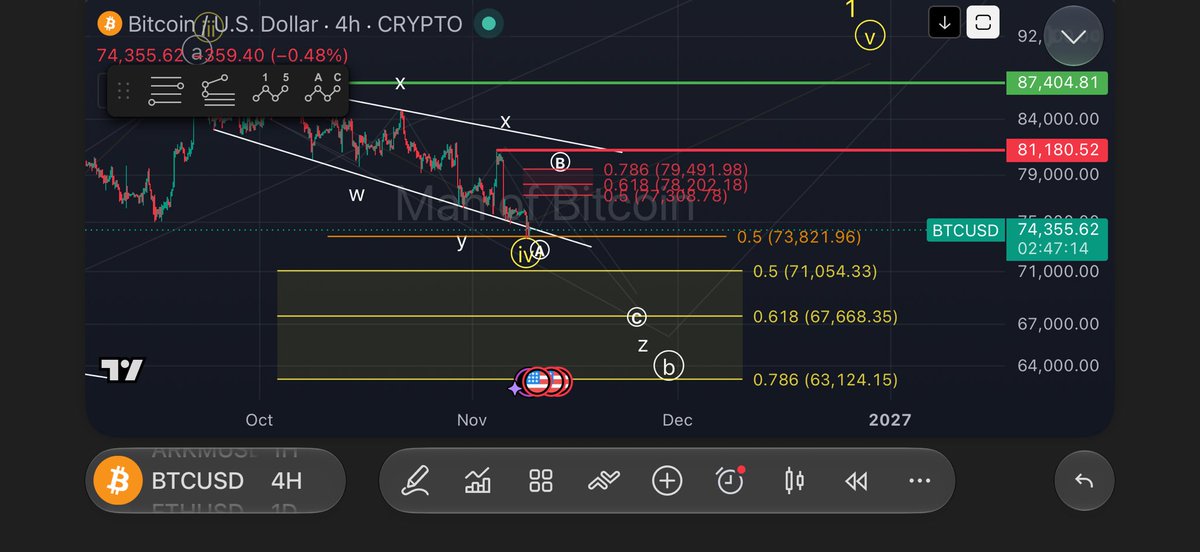
$BTC is holding above critical support levels. The bulls NEED to defend this area.
A decisive break below the last swing low at $73,700 would suggest that wave-C is already unfolding to the downside.
$BTC: The 50% Fib retracement level needed to keep another high on the table is at $73,821. A break below this level would provide further confirmation that the bulls have failed.
The 50 EMA is also sitting around $75K. The bulls need to step in now, or $68K could be on the horizon. 🤷♂️
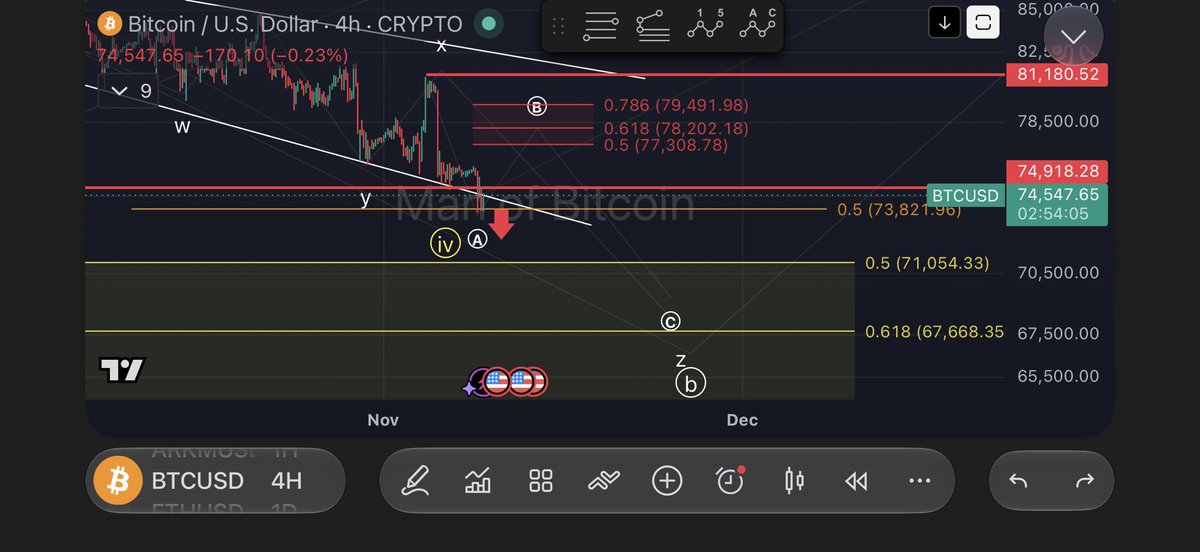
$BTC has broken below the $75K level, which is a sign of weakness. A daily candle close below this level would provide further confirmation that price is heading for a deeper pullback.
$BTC: A quiet weekend so far. Next week should give us more clarity on the direction.
For now, as long as we don't see a decisive break below $75K, I expect at least a bounce to the upside.
Resistance is between $77,912 and $79,757.
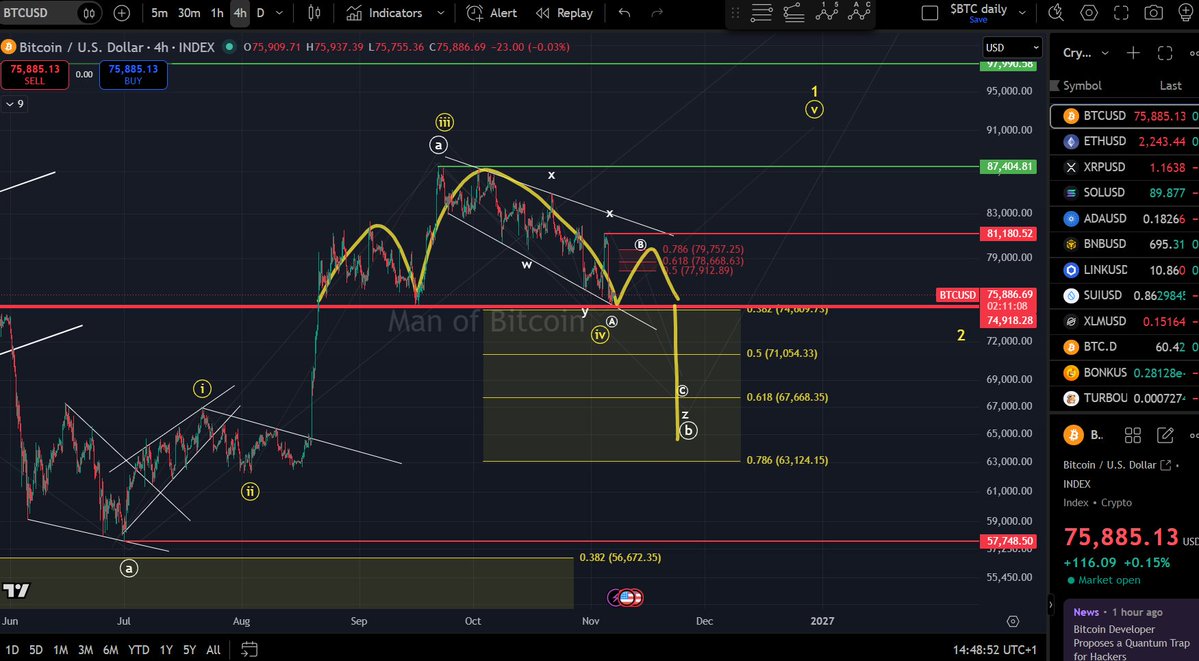
$BTC zoomed out:
A potential head-and-shoulders pattern is forming. One more shoulder could complete the pattern.
A decisive break below $75K would likely send price toward the $67K–$63K region.
$BTC is holding support above the descending trendline and the $75K level.
A wave-B bounce is likely from this region. Resistance is between $77,912 and $79,757.
For reference, my buy order was triggered at $75,000. This is a swing trade only. SL below the last swing low.
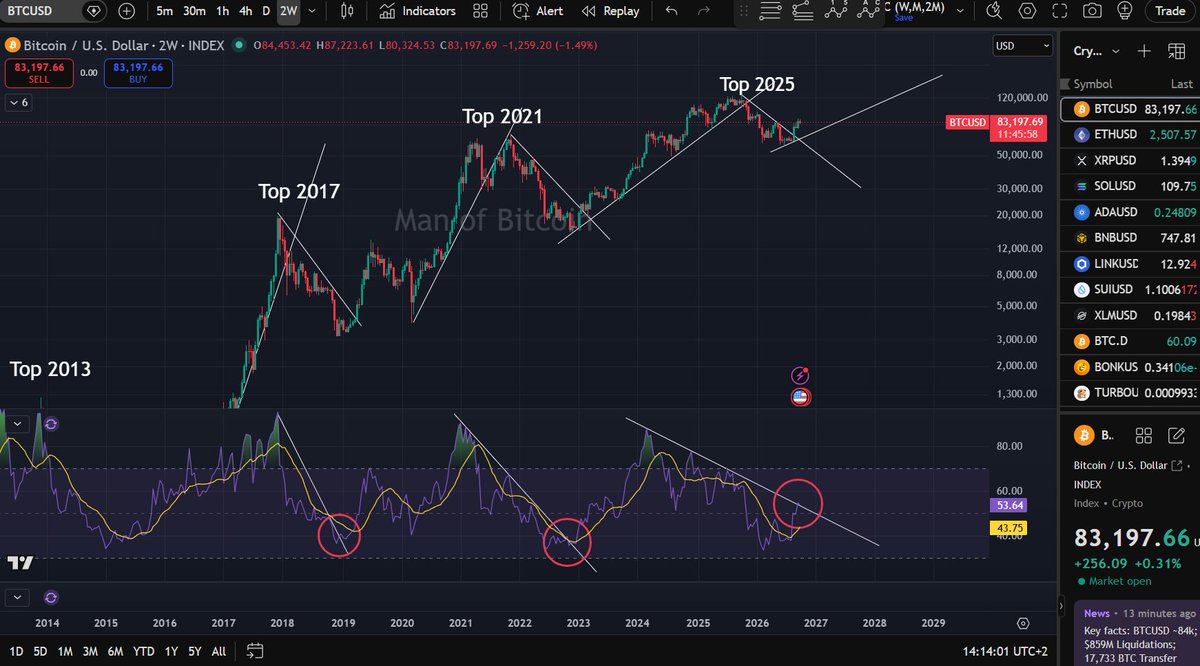
$BTC on the 2-week timeframe:
The higher the timeframe, the more reliable the indicator.
Indicator: RSI
RSI is at a pivot point. A rejection from this area could be the first sign for a deeper pullback.
$BTC: Due to the complex correction, I have updated the wave count to a WXYXZ pattern. I think this fits the current structure best.
Resistance is between $78,094 and $79,836.
Ideally, price remains below $81,180 to keep the white roadmap intact.
$BTC: A potential triangle pattern is forming, which often breaks to the upside.
However, a break to the downside would likely send price toward key support at $79,538.
Resistance remains unchanged: $81,229–$83,786.
$BTC has made an impulsive move after reacting to my ideal buy zone.
Congratulations to everyone who entered a trade!🎉
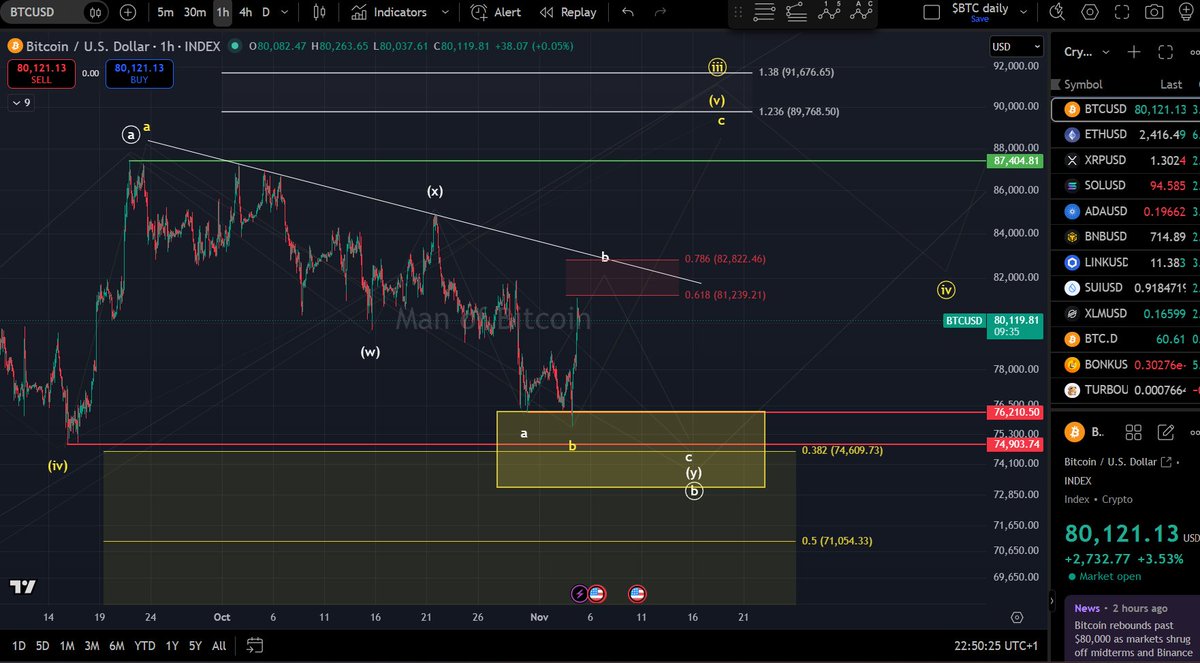
I have updated the wave count to a complex WXY correction, with resistance for a potential wave-B high between $81,239 and $82,822.
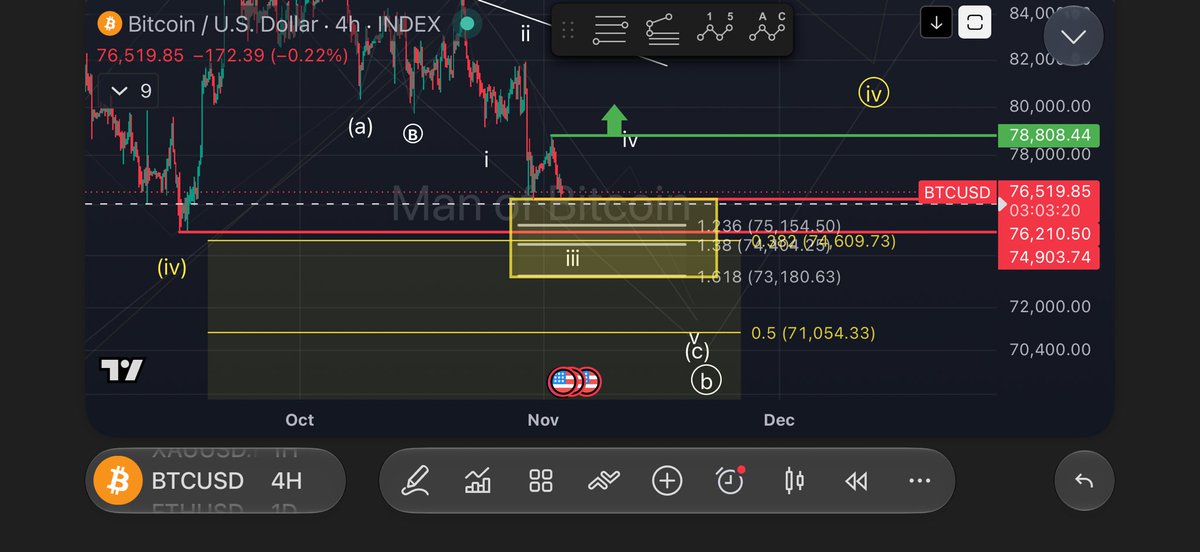
$BTC reached my ideal buy zone and reversed to the upside. I see the move to the downside as a potential wave-iii low.
A decisive break above $78,808 would be the first sign that a local low is in, with price potentially heading toward the descending trendline.
$BTC: It appears that the bulls are not interested in buying at these levels.
That said, the yellow zone highlights where a potential reversal could occur, at least for a wave-iii low.
$BTC reversed to the downside after reacting to key resistance and has now reached a zone that could be interesting for the bulls.
The bulls need to step in here to prevent further downside.
$BTC reacted to key resistance at $78,733.
Ideally, price stays below the last swing high to keep the downside pressure intact.
A decisive break above resistance would suggest that a more complex correction is unfolding, potentially leading to a retest of the descending trendline.
$BTC: The reversal from the 100% Fib extension level is weak, with price facing resistance at the channel’s lower boundary.
Next week should give us more clarity on the direction.
👉Key resistance: $78,733
👉Next downside target: $75,154
$BTC: The white roadmap remains my preferred scenario. I’m keeping the yellow roadmap on the chart because it is still technically valid.
As long as price remains below $78,733, I expect at least one more low.
$BTC: I have added a channel to the chart. A retest from below could send price toward the next downside target at the 1.236 Fib extension, the minimum requirement for a third wave.
As long as price remains below $78,733, I expect lower prices.
$BTC: As long as price remains below $78,733, my preferred roadmap is the white one.
The ideal target for wave-iii is the 1.38 Fib extension at $74,388.