Ultimately, power will rule. This is true of any system. For example, it has repeatedly been shown that systems of government have only worked when those with the power value the principles behind the system more than they value their own personal objectives. When people have both enough power to undermine a system and a desire to get what they want that is greater than their desire to maintain the system, the system will fail. For that reason the power supporting the principles must be given only to people who value the principled way of operating more than their individual interests (or the interests of their faction), and people must be dealt with in a reasonable and considerate way so that the overwhelming majority will want and fight for that principle-based system. #principleoftheday
There is a hierarchy in Hollywood and I’ve done every level of it.
At the very top is a global theatrical film like Marty Supreme. Everything changes up there: access, press, expectations.
I thought I was at the top before. I wasn’t.
Must read. Common questions I receive on Wyckoff Method. Here is the answer.
There are two variations of the Wyckoff Accumulation Schematic here there are:
#1 and #2 - but how do we know which will play out?
Both are bullish setups leading to markup.
The two Wyckoff accumulation schematics (often labeled Schematic 1 and Schematic 2) represent common variations of how the accumulation process unfolds in a trading range (TR) after a downtrend.
Both follow the same core Wyckoff principles and five phases (A–E), but they differ primarily in Phase C the test for remaining supply and how the range resolves into the markup phase.
These schematics come from Wyckoff's original teachings (later adapted and popularized by figures like Robert G. Evans at the Stock Market Institute/Wyckoff Analytics). They illustrate idealized patterns of institutional ("Composite Man") accumulation.
Key Similarities
Both occur after a prolonged downtrend.
Phase A: Stops the decline with Preliminary Support (PS), Selling Climax (SC), Automatic Rally (AR), and Secondary Test (ST) → defines the TR boundaries.
Phase B: Sideways consolidation ("building the cause") where smart money accumulates on low volume, shaking out weak holders.
Phase D: Signs of Strength (SOS), Last Point of Support (LPS), and breakout preparation.
Phase E: Markup (uptrend) begins as supply is exhausted.
Volume decreases on tests of support and increases on rallies/breakouts.
Goal: Accumulate shares quietly before a major advance.
Key Differences: Schematic 1 vs. Schematic
2
Aspect
Schematic 1 (with Spring)
Schematic 2 (without Spring / Higher Low Test)
Phase C Test
Features a Spring (or terminal shakeout) price briefly breaks below the TR support (below SC/ST lows), often on wide spread and high volume, then quickly reverses upward. This traps sellers and tests for any remaining supply.
No true downside break. Instead, the test in Phase C forms a higher low compared to the SC/ST. Price holds above the prior support level without undercutting it significantly.
Aggressiveness
More aggressive shakeout designed to scare out remaining weak hands/panic sellers. Classic "fakeout" below support.
More subtle/stealthy —support holds firmly; no dramatic trap needed because supply is already exhausted or weaker.
Recognition
Most recognizable and "textbook" version; dramatic breakdown + reversal often provides high-conviction entries (especially on the Spring test or Last Point of Support after recovery).
Less obvious; looks like simple consolidation or a failed breakdown attempt. Breakout often occurs more directly from the range without a prior dramatic reversal.
Trading ImplicationSpring → test of Spring often best low-risk entry (buy the recovery). Higher probability if volume dries up on the breakdown and surges on reversal.
Entries around higher-low tests or early SOS.
Avoid forcing a Spring expectation — missing this variant can cause traders to overlook valid setups.
Frequency / Requirement
Spring is common but not required many real accumulations show this.
Shows a TR where price never truly violates support also valid and frequent in stronger basing patterns.
In essence:
Schematic 1 = "dramatic test" version (Spring shakes out supply aggressively).
Schematic 2 = "quiet test" version (support holds without breach; higher low confirms strength earlier).
Real charts often blend elements of both. The absence of a Spring doesn't invalidate accumulation it just means the test of supply was less violent. Wyckoff emphasized context, volume behavior, and the overall narrative over rigid adherence to one schematic. If you're analyzing a specific chart, the presence/absence of a clear Spring (plus volume and support behavior) is usually the quickest way to classify which variant you're seeing.
Day 3 in Davos. If AI is the headline, GLP-1s are the next pressing issue everyone’s pulling me aside to talk about.
Business leaders can’t cover GLP-1s unless employees actually stay on them long enough for the health benefits—and the economics—to work.
i despise when i read someone’s writing and it’s obvious that they didn’t even attempt to disguise that they used AI to write the entire piece; you can tell by specific word choice and sentence structure, sometimes by the mechanical delivery of ideas
the human soul yearns to be heard and writing is a consequence of passion, while it’s great that more folks can communicate their ideas with the help of AI, its sad that someone’s inner voice can only be eked out via prompting
the world wants to hear YOU, in your authentic entirety
You asked. Vulcan delivered.
7+ features requested by you have been added to the VulcanVerse roadmap:
🔥 Skill trees
🔥 Group dungeons
🔥 Expanded quests
🔥 Avatar + Vulcanite combat
🔥 Interactive profession assets
Now onto building.
🚀 Institutional trust infrastructure just hit the spotlight: BitGo’s NYSE debut with a $2.59B valuation and Ledger’s planned >$4B listing underscore that capital markets are increasingly valuing security-centric crypto infrastructure.
(https://t.co/rQaP1b8tKr)
These moves aren’t just about IPOs — they reflect a broader structural shift: as fraud, theft, and custody risks grow, market participants are placing real capital behind entities that secure and verify digital assets.
Meanwhile regulatory timelines remain fluid, reminding us that governance and compliance layer risk still matters for long-term adoption.
#CryptoSecurity #Custody #Infrastructure #Web3 #MarketEvolution #LayeredTrust
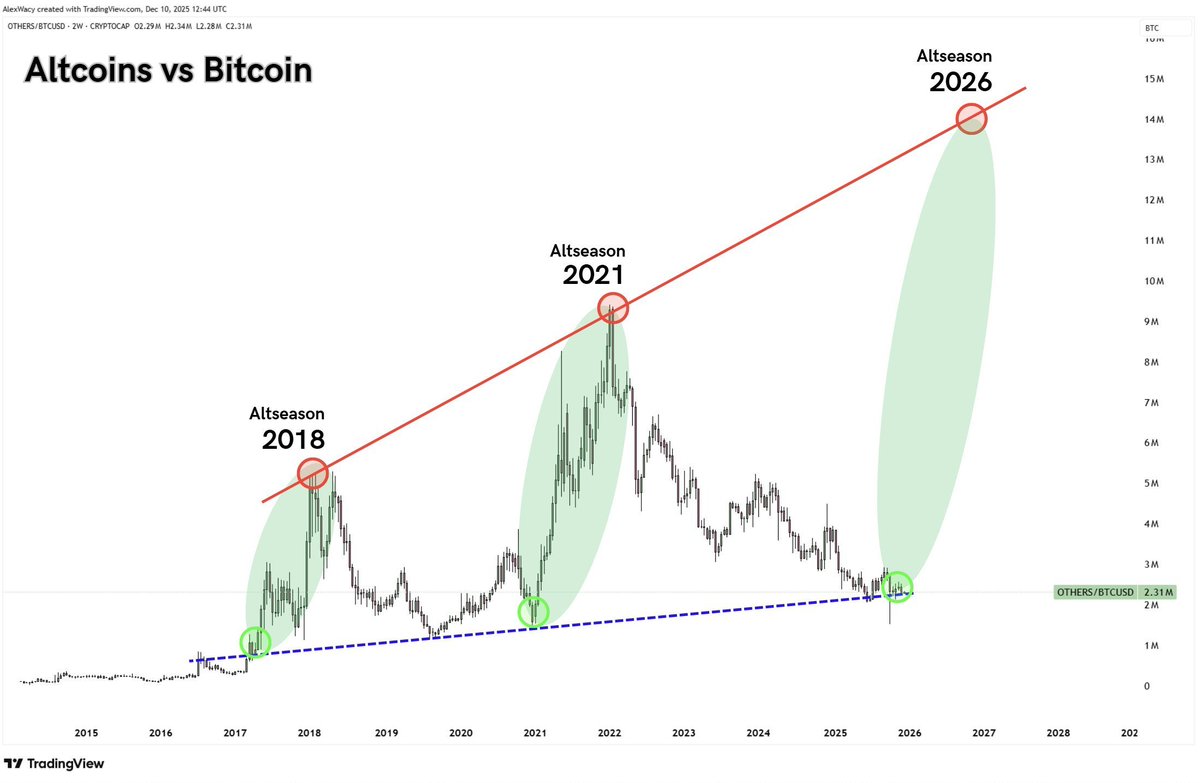
This chart hasn't left my mind for months....
Altseason 2026 might follow the exact same pattern.
Multi-year trend break ➜ Golden cross ➜ Parabolic move
2017: 83x
2021: 157x
2026: Loading
If history repeats, we're heading into the biggest altseason in crypto history.