Before zone alerts: Store A's higher revenue gets read as 'better layout,' Store B told to copy it. After zone alerts: Store A's checkout zone was chronically overloaded the whole time. Same camera. Different model.
Before zone alerts: cleaning route is a year old, ignores where traffic actually shifted. After zone alerts: route rebuilt around current zone data. Same camera. Different model.
Before zone alerts: member quietly stops coming, exit survey blames 'schedule.' After zone alerts: the overcrowded zone shows up in data weeks before the cancellation. Same camera. Different model.
Before zone alerts: high traffic assumed = working display, more inventory ordered. After zone alerts: traffic is high but dwell is 2 seconds — display moved, engagement triples. Same camera. Different model.
Before zone alerts: room booked, sits empty 3 of 6 hours, teams wander the hallway. After zone alerts: empty room released in real time, teams seated in 2 minutes. Same camera. Different model.
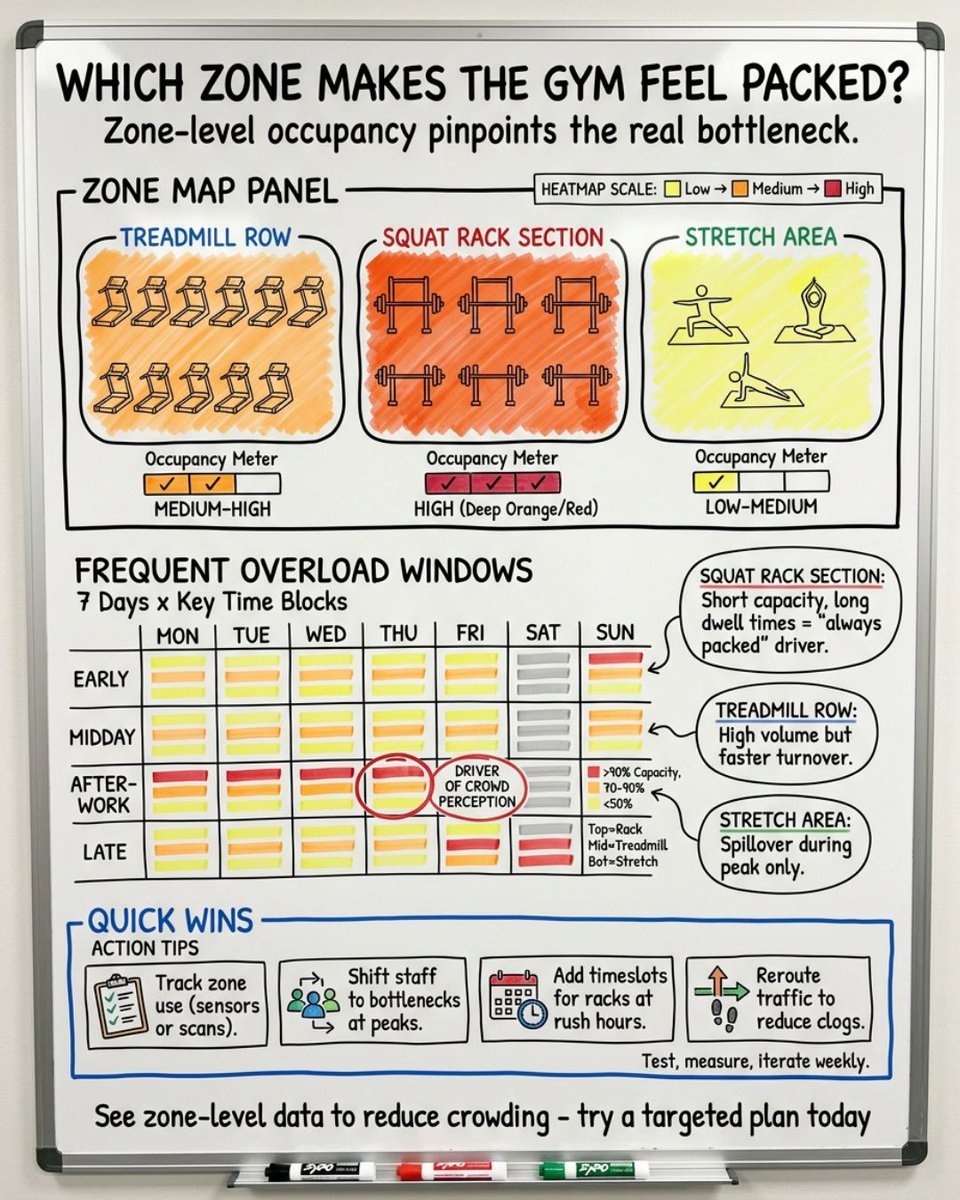
Before zone alerts: cardio row fills, members wait 15 minutes, nobody notices until a complaint. After zone alerts: threshold crossed, staff redirects before the wait happens. Same camera. Different model.
Before zone alerts: entry zone overloads, nobody notices for 20 minutes, customers leave. After zone alerts: threshold crossed, staff moves before the backup forms. Same camera. Different model.
Zone avoidance is a metric gym operators almost never track. The area that should be busy but consistently shows low utilization is telling you something — usually before it shows up in churn.
Question for gym operators: if you could see exactly which zone consistently overloads — not the whole gym, just that specific zone — what would you change first?
Gym equipment decisions based on member complaints miss the real picture. "Cardio feels crowded" doesn't tell you which zones, at what times, or whether expansion would even help. Zone data does.
Gym operators know their peak hours. What they usually don't know: which specific zones hit capacity, which sections are empty, and where the member experience actually breaks down.
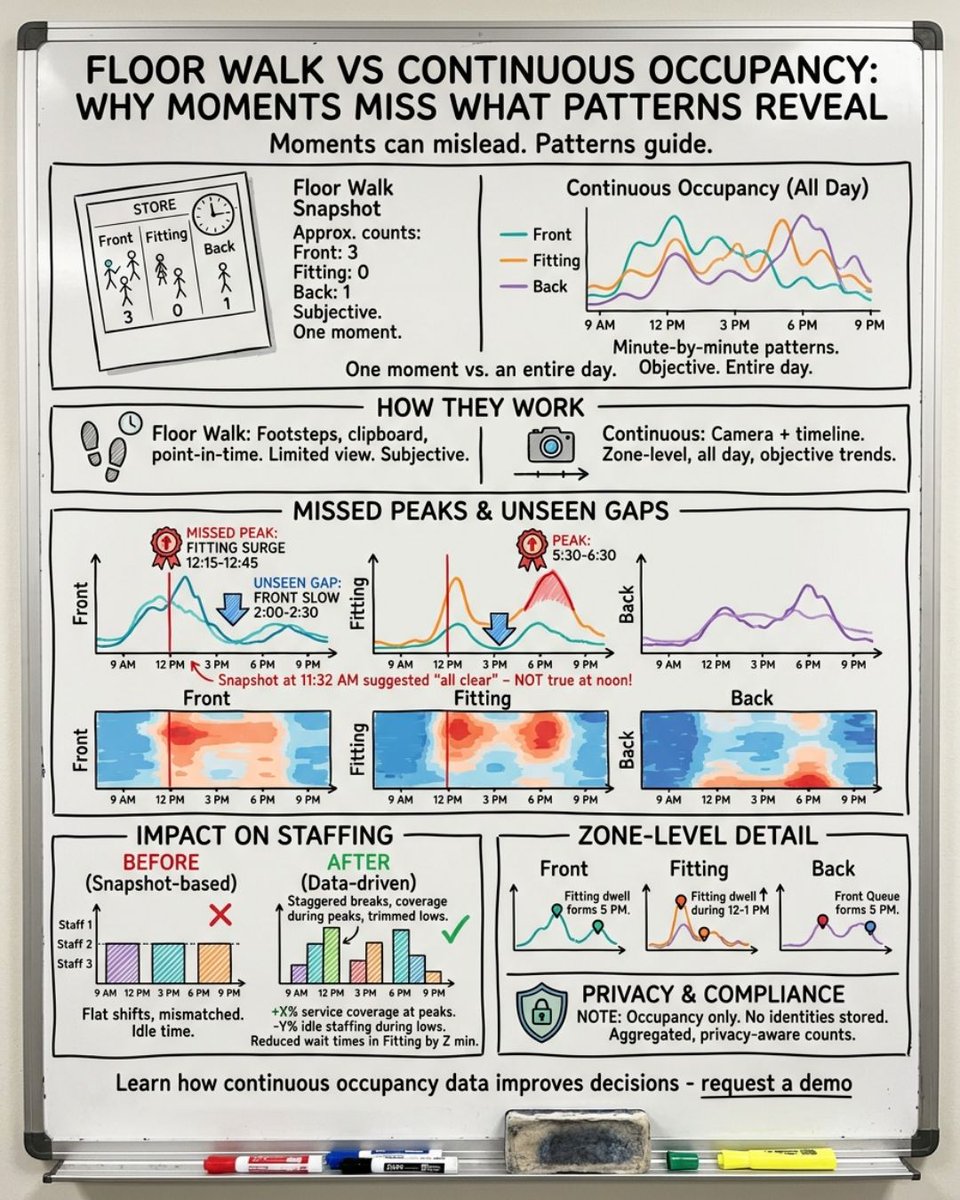
Your mental model of which zones are busiest is formed from floor walks and memorable incidents — not data. Zone-level occupancy almost always shows a different picture than the one operators assumed.
Before zone alerts: line builds → complaint → react. After zone alerts: threshold crossed → alert fires → move before backup forms. Same camera. Different model.
Retailers know what sold. They don't know what happened before the sale. Which display stopped people. Which zone had traffic but no engagement. That's in your camera feed.
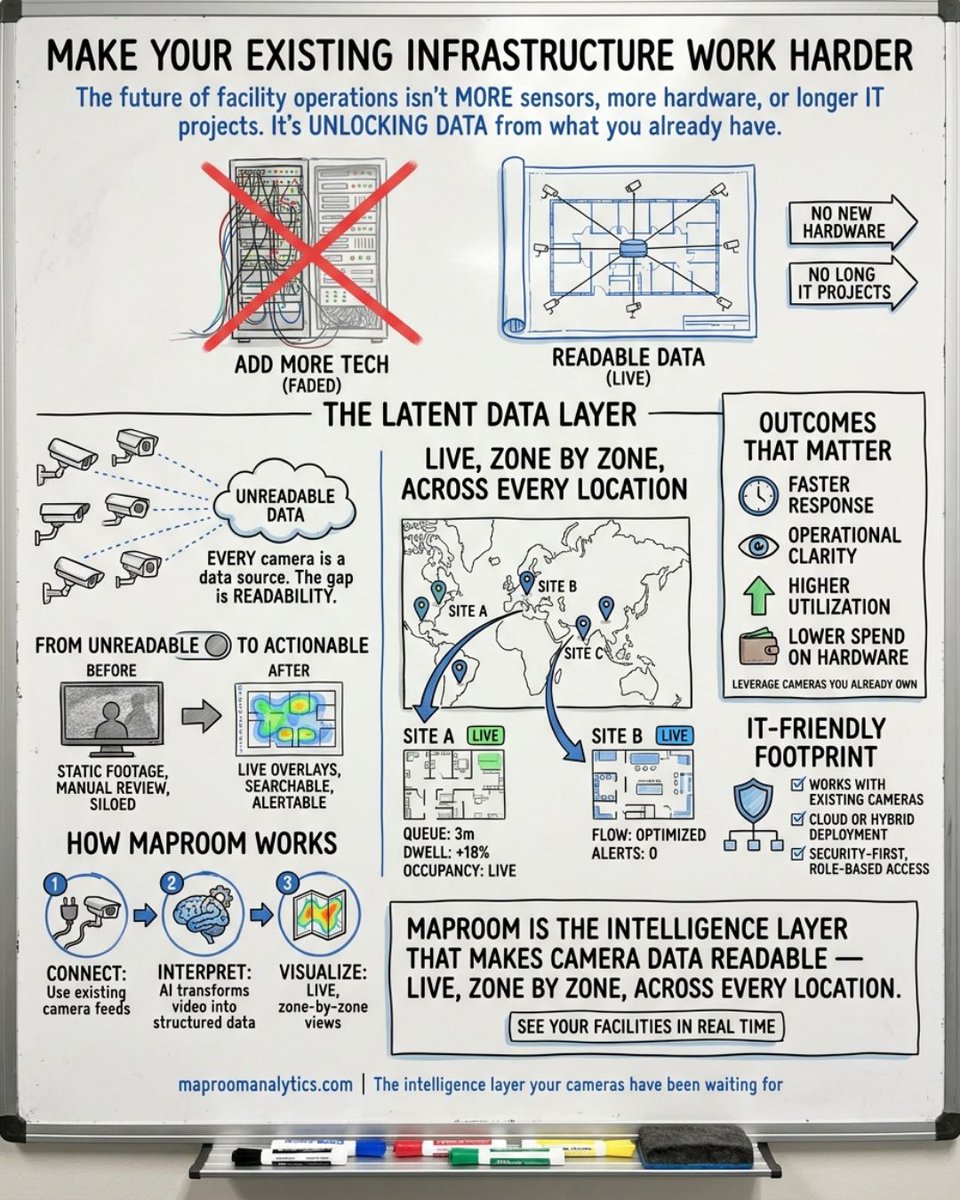
What MapRoom gives you from cameras you already have: live zone occupancy, dwell time, flow, threshold alerts, trends, multi-location comparison. No new hardware. https://t.co/4ALbBpL9aZ
Better scheduling tools aren't the answer. Better occupancy data is. Zone-level real-time data tells you where staff should be — not just how many. MapRoom provides it.
People counting tells you how many entered. Zone-level occupancy tells you what happened next. Where they went, stayed, and got stuck. That's the actual insight.
Pick the zone you're always guessing about. Connect the camera. Live occupancy in minutes. One zone, one camera, an answer instead of an estimate. https://t.co/4ALbBpL9aZ
Security cameras: review footage after incidents. Operations cameras: respond before problems peak. Same hardware. Completely different model. MapRoom makes the shift.