@insidegadsmind it really does feel like a buying opportunity.
but there is some evidence that suggests companies revenue growth changes when the founder is removed.
but also … that it doesn’t matter.
can't argue that the numbers compelling here. but as is somewhat expected, the change from founder led to a professional ceo tends to lead to a slowing in the growth rate.
could be argued this is due to stage .... but apple and steve jobs seems to disprove that .... perhaps he is too much of an exceptional case
food for thought
forward pe’s look real cheap atm …
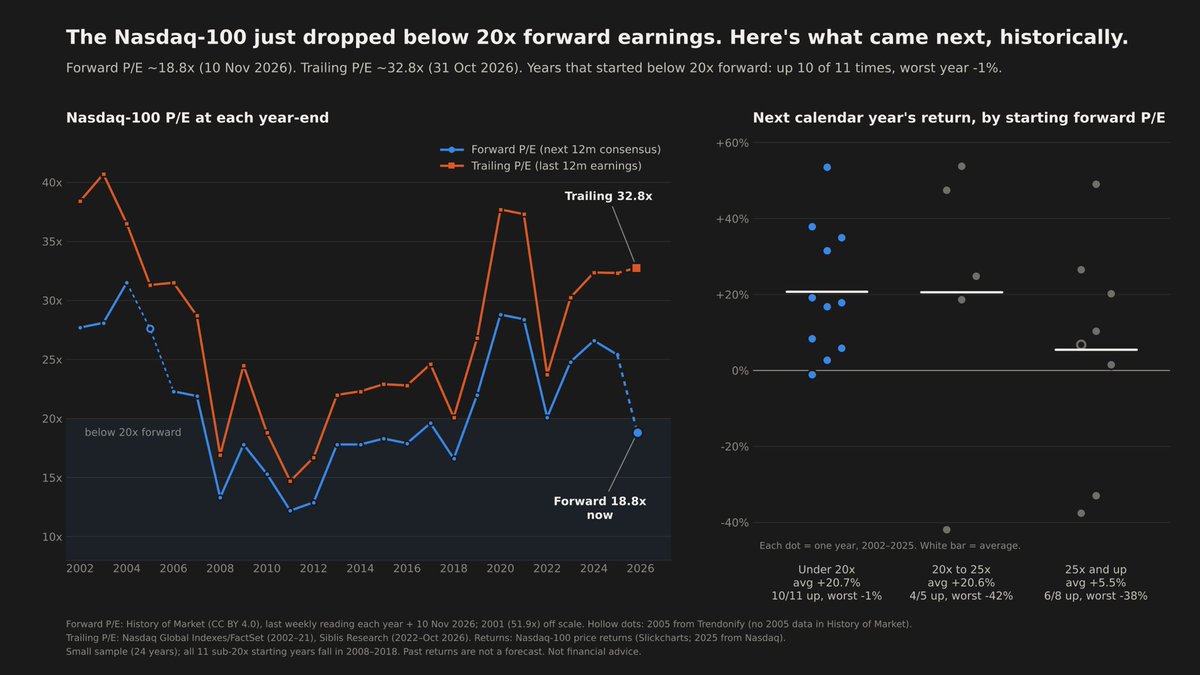
took the index's forward P/E at every year-end since 2001 and checked what it did the following year. 11 years started under 20x (all of them 2008–18), 5 at 20–25x, and 8 above 25x.
——>>
buying under 20x didn't give you a better average year than buying at 20–25x (+20.7% vs +20.6%). what it gave you was no crash. the worst year was -1%. Starting above 20x, the worst years were -42%, -38% and -33%.
but today's "cheap" rests on one number. Trailing P/E is about 33x while Forward is ~19–21x.
so you need about 50% earnings growth ….
the analysts seem to believe it it’s going to happen while parts of the market, like Micron trading at 3.3x forward, and Sandisk at 2.9x …. think it’s all about to fall apart ..
if the analysts are right, you're getting 2016–18 multiples on 2026 earnings.
but in terms of risk / reward, at least on this one metric, appears to be a decent bet ….
but it’s important to note, the market used to trade under 20 forward quite often. feels cheap in the current environment but she’s been a long long run ….
Totally agree on the shape. But do think SNDK in its best year ever is the wheel's worst scenario,
Have gone back and tested it on stocks picked at random
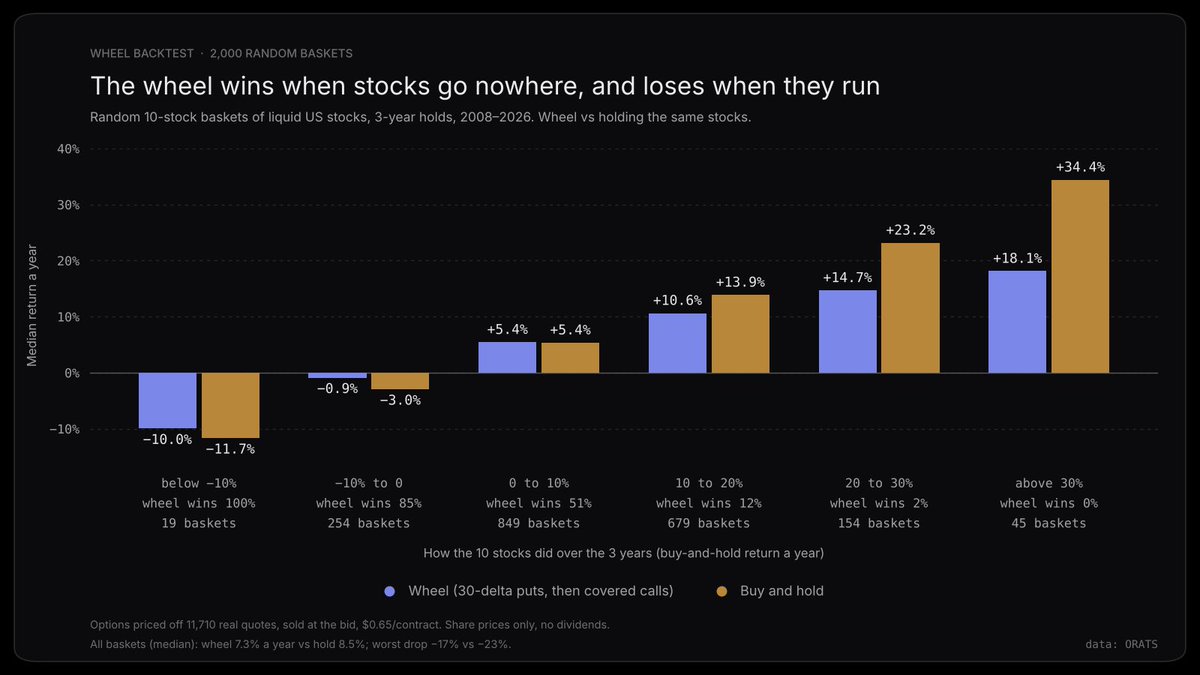
2,000 random 10-stock baskets of liquid US stocks, 3-year holds, 2008–26.
The option prices are checked against 11,710 real quotes, sold at the bid.
Median, wheel vs holding the same stocks:
🔴Return: 7.3%/yr vs 8.5%
🟢Worst drawdown: −16.7% vs −22.7%
🟢Return / volatility: 0.59 vs 0.55
🟢Lost money over 3 yrs: 10.9% of baskets vs 13.7%
So it kind of looks good … but basically you give up some return to save a little bit of pain.
If you simply adjust these same stocks to match the wheel's lower risk level, to match vol - (~72% stock, 28% T-bills) and you get 6.8%/yr.
Its market dependant:
Falling market 📉 → wheel beat holding 85–100% of the time.
Flat market → it’s basically a coin flip.
Up market 10–20%/yr 📈 → wheel only wins 12% of the time.
Banger market 30%+/yr 🤑→ 0% - the wheel looses every time and give up almost half the possible returns (18% vs 34%/yr).
Dividends make it a bit worse for the wheel.
If you decided simply to wheel SPY, with every trade tested on a real quote, 2010–26, total return:
Wheel: 11.55%/yr, DD −28.3%, return / vol 0.88
SPY: 14.03%, −31.0%, 0.87
SPY held at the wheel's risk: 11.77%, −25.0%, 0.89
Basically it’s a whole lot of work for very little upside!
very leveraged ETF leaks.
Capturing that leak without taking on too much risk is the hard part.
But even now, after years of people trading these funds, it’s still there.
@Ericontheoffer@GoshawkTrades There are rules around backtesting to avoid these traps.
In sample, out of sample data.
To ensure you are not simply curve fitting.