$FETchai
weekly 🤖 Peak ~$3.50 in Mar 2024.
Now −96% in a long W-X-Y-Z base.
Price $0.134 just above my red support at $0.115, MA ~$0.19 overhead.
Resistances $0.31 / $1.00.
Cycle target zone $5.6-9.0.
AI-agent network.
Not financial advice
2017 : 2026(XX)
History always repeats itself. And within every wave, the same patterns continue to recur.
We call this a fractal.
Energy : Trading Volume
Frequency : Fibonacci ratio
Vibration: Wave
Prosperity ✨️
🙃♾️🟢🔥🦅🌈🌊🎃🎄🌐🚀
$PEPE is trading around $0.00000455.
And this weekly chart is showing a setup that could become very interesting.
Look at the bigger picture.
In December 2024, $PEPE reached its all-time high near $0.0000283.
The rally was explosive.
But what followed was a brutal correction.
Lower highs. Failed recovery attempts. Nearly two years of persistent selling pressure.
And now price is trading more than 84% below its previous peak.
But here's what caught my attention.
$PEPE has returned to a major historical liquidity zone, near the same price region where previous bullish expansions began.
And despite the prolonged downtrend, price is showing signs of stabilization around this long-term support area.
Could this be the beginning of another accumulation phase?
Possibly. But buyers still need to prove themselves.
Here's my roadmap.
$0.0000055 — First resistance to reclaim.
$0.0000075 — Important short-term breakout level.
$0.000010 — Psychological resistance.
$0.000016 — Major historical supply zone.
$0.0000283 — Previous all-time high.
And $0.000034? That's my aggressive bull scenario.
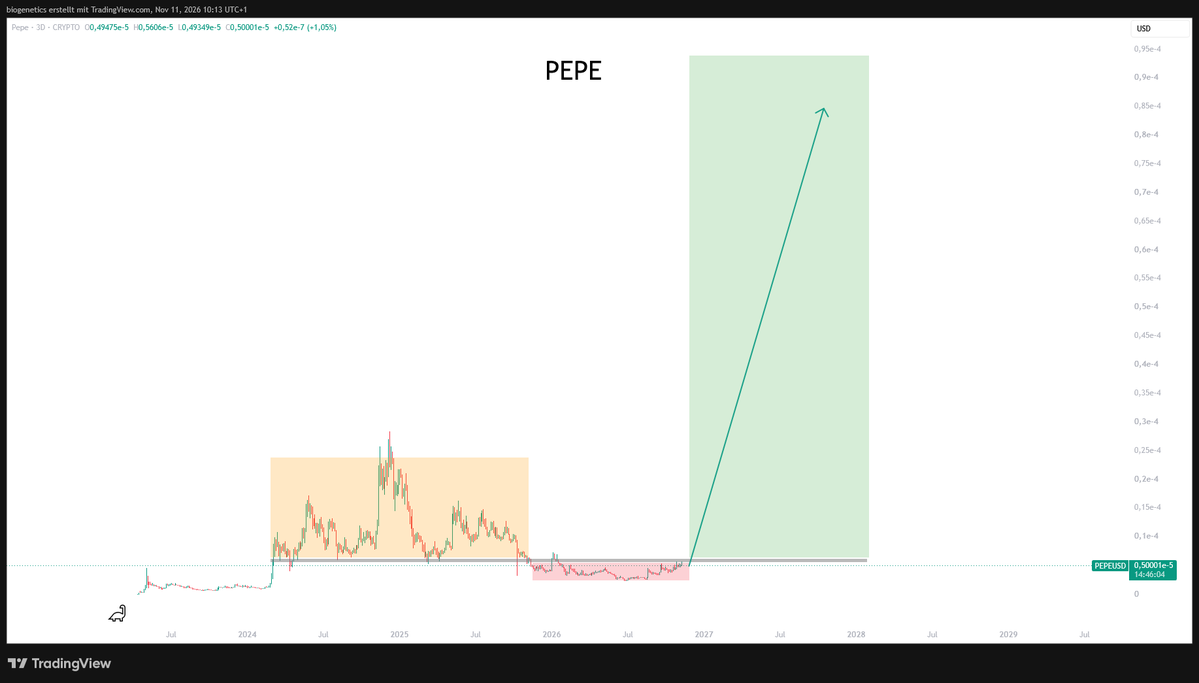
The chart illustrates a potential 750% expansion from its marked historical reference point.
That's a massive projection.
But here's what makes this setup interesting.
$PEPE has already demonstrated its ability to produce explosive moves when speculative demand and market liquidity return.
And now price is approaching another historically significant region.
Still, a liquidity zone alone doesn't confirm a bullish reversal.
First, I want to see $PEPE establish higher lows and reclaim $0.0000055 on the weekly timeframe.
A sustained breakout above $0.0000075 with expanding volume would provide stronger evidence that buyers are regaining control.
Without those confirmations, another leg lower remains possible.
But think about the psychology.
In late 2024, traders were chasing $PEPE near its all-time high.
Now it's down more than 80%, and the market looks completely different.
Interest has cooled.
Volatility has compressed.
And the previous bullish momentum has disappeared.
That doesn't automatically mean the bottom is in.
But if buyers successfully defend this long-term base and begin breaking the sequence of lower highs, the next expansion could be significant.
The 750% projection is speculative, not a guaranteed outcome.
I'm watching whether this historical liquidity zone can become the foundation for a new bullish cycle.
The structure comes first.
The bigger targets come after confirmation.
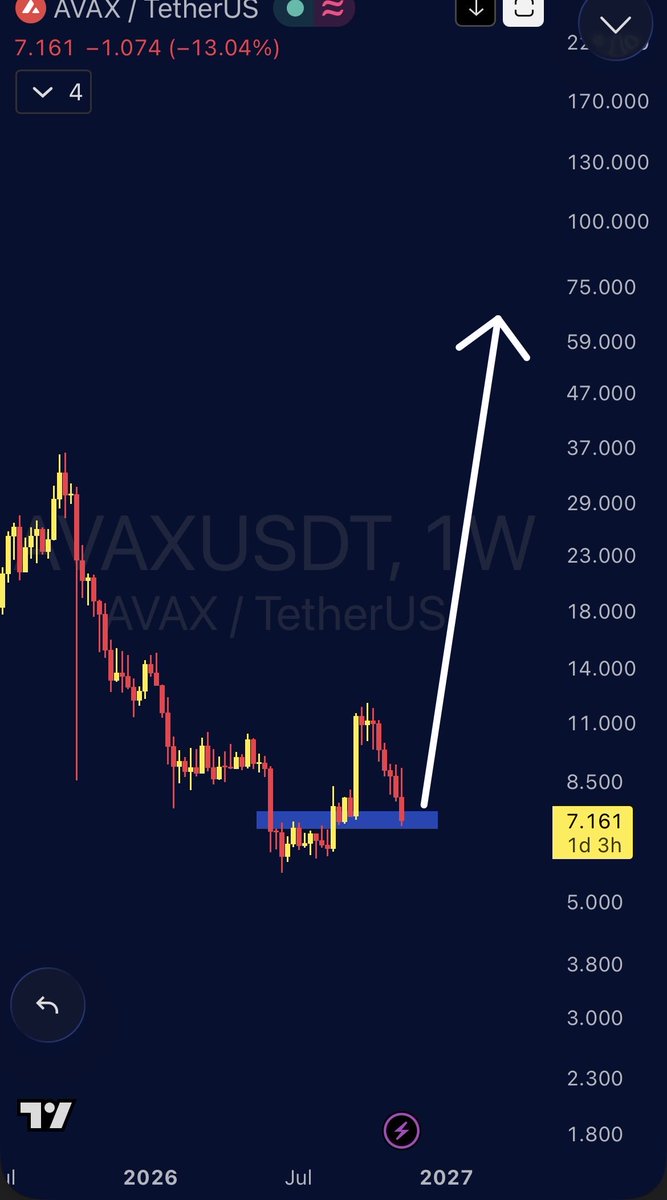
$AVAX After an extended #bearish move within a falling wedge , $AVAX is showing a potential shift in momentum.
The recent breakout above wedge resistance is an early #bullish signal.
If price holds above the breakout zone, we could see a continuation toward $10.50 (+26%). Waiting for #bullish confirmation.
$AVAX
After an extended bearish move within a falling wedge , AVAX is showing a potential shift in momentum.
The recent breakout above wedge resistance is an early bullish signal.
If price holds above the breakout zone, we could see a continuation toward $10.50 (+26%).
Waiting for bullish confirmation. 🎯
#AVAXUSDT #AVAX #Crypto
@NUnl Wat een verloren zaak!
De Nederlander gaat echt kapot als dit door gaat!
Totaal geen belastingplan voor de eigen Nederlander, alles gaat naar het buitenland!
LONG $PEPE 🐸🐸
#1000PEPE 📈🚀
Buying In Spot Only #PEPE 🔥🔥
For More Best Results & Leverage Trading Join Our TG ✔️ Link In Profile Bio ⛓️
Nfa.. Dyor..