Why is it highly likely that BITCOIN is going to the 73-72K region?
1. 0.382 of this bull market wave and 0.618 FIB from the last wave are aligning.
2. One of the Wyckoff schematics aligns with the charts.
3. RSI double divergence on daily.
4. RSI divergence on weekly.
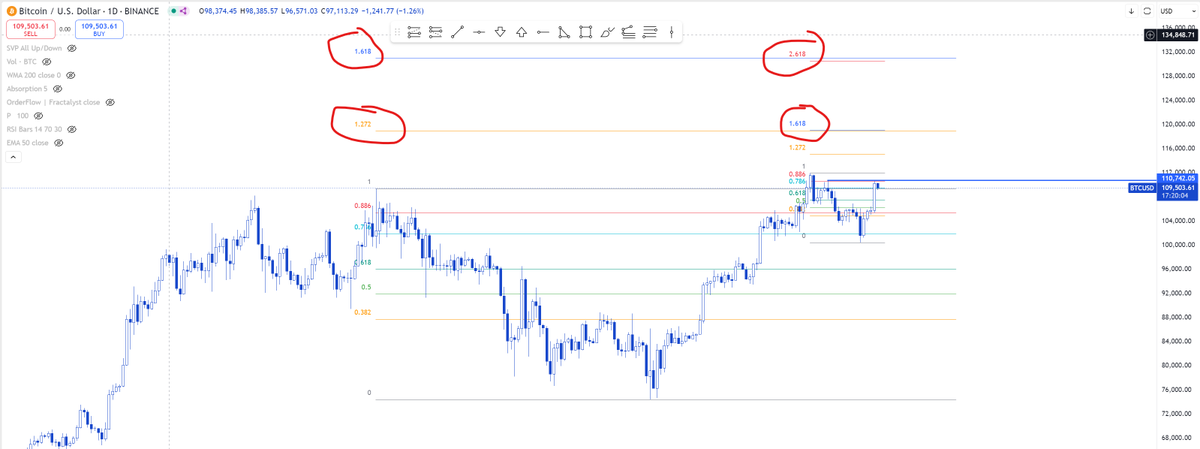
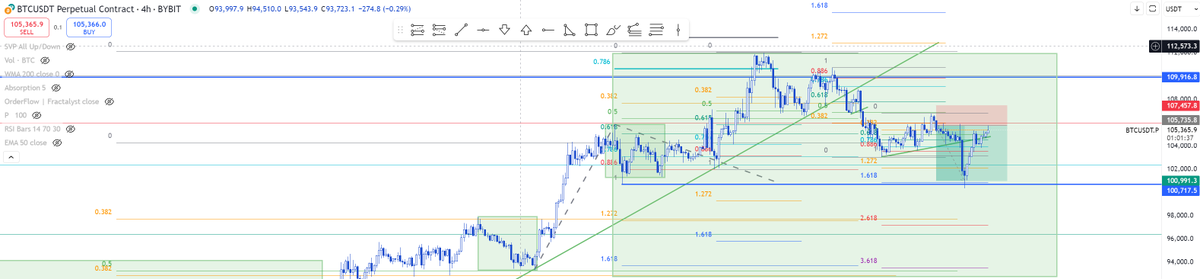
5. We are at previously mentioned 1.618 fib extension, usually a strong resistance.
With so many confirmations, you'd be mad to long BTC now. I am sitting on my hands.
Naysayer: "Technical analysis doesn't work on new coins." 🤣
PUMP token on pre-market: Perfect entry and exit based on TA. Missed a planned short at 50 FIB as I was away, but set take profit at this level from a quick LONG got filled almost exactly at the top. 1:4 RR ratio.
TA works!
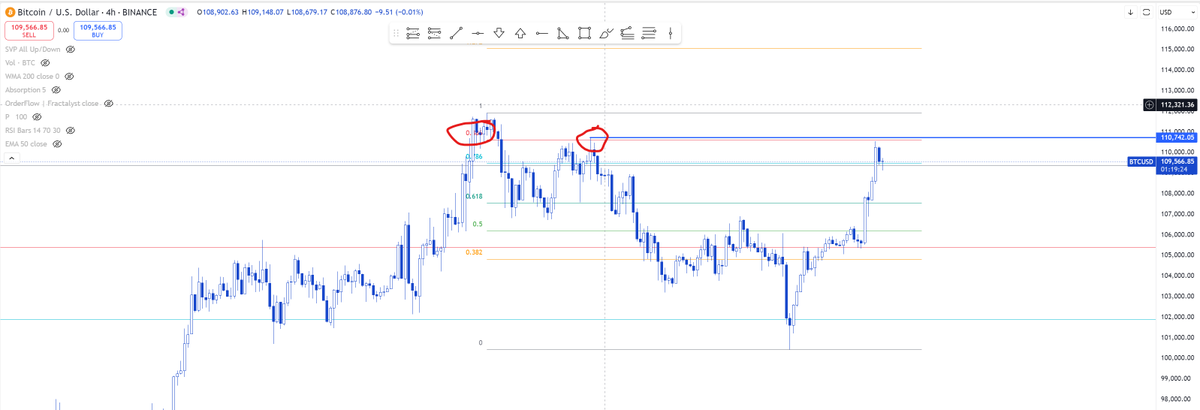
The moment of truth. If we pass these levels, my previous statement is invalid. I'd be happy to be wrong. 😀 It's all probability anyway, so nothing is certain. Let's go up! 👆👆👆🙏🙏🙏
Will this scenario play out, or will we continue rising? The recent move up on smaller time frames had strong bullish volume, but the daily chart does not look as good.
It's 50/50, but I wouldn't go long here.
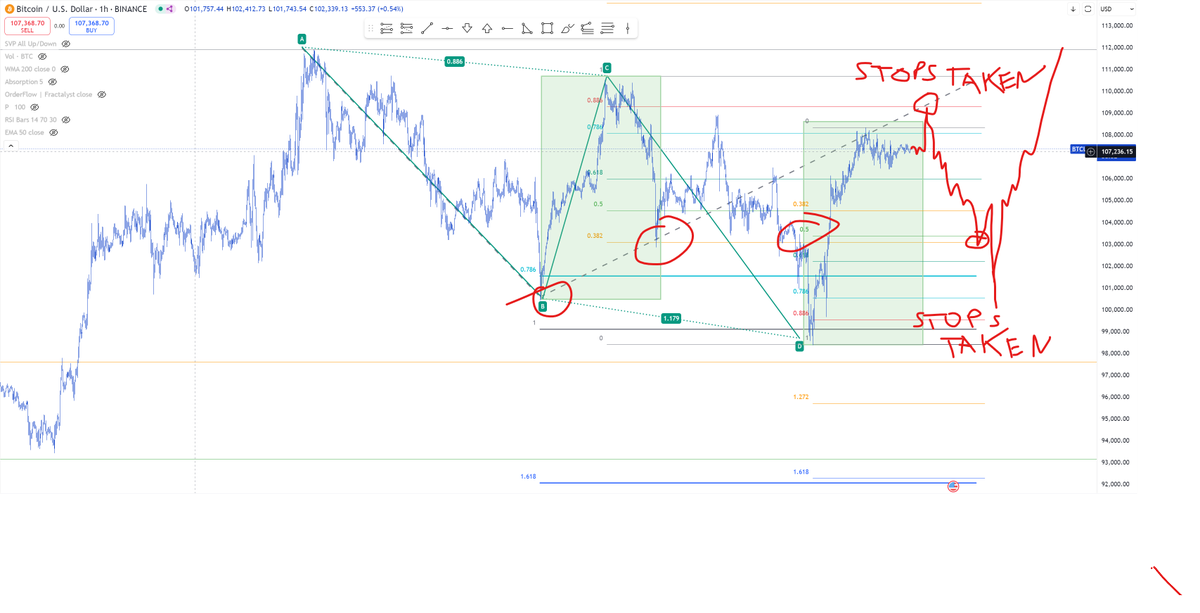
So.. I follow the rule "trade what you see", but lets play the speculative game for a moment. 😀
We spike up to take liquidity (stop losses) to the fib level, then go down to fill H/S pattern + nice 50 or 78 FIB levels to take long positions liquidity (stop losses). Then we move up after draining a liquidity and making everyone angry.
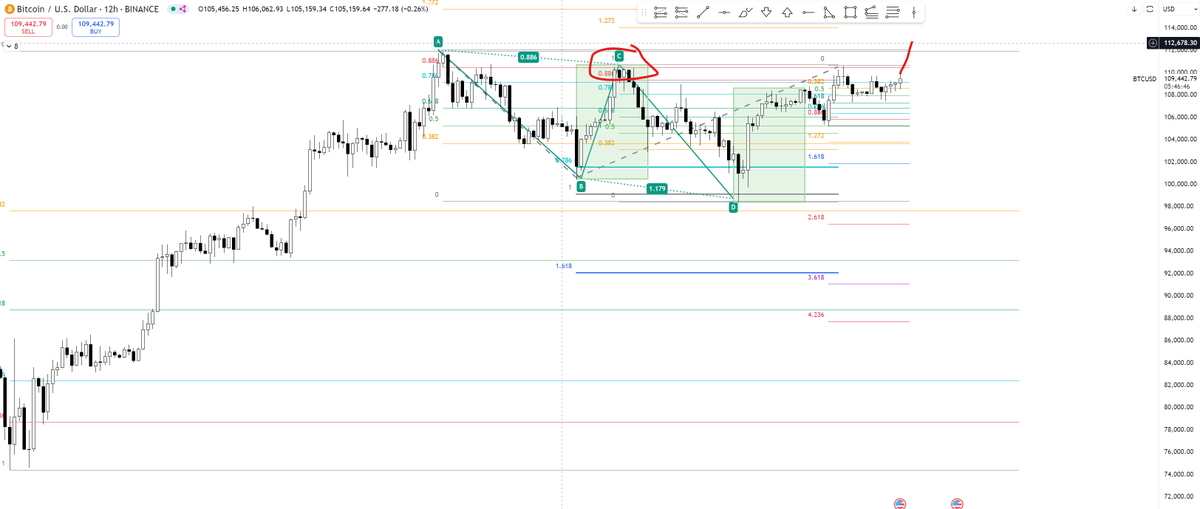
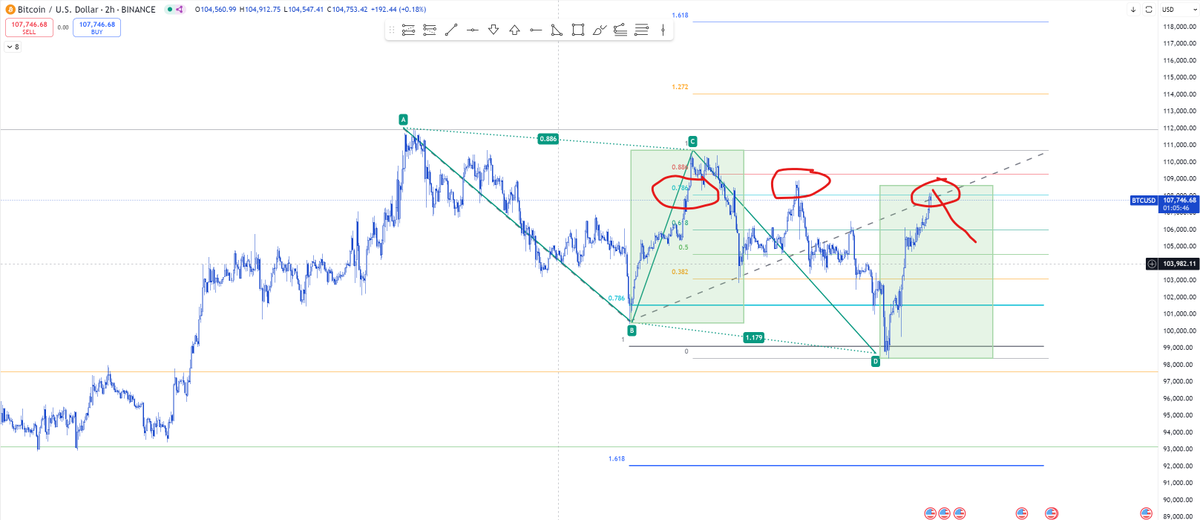
We are at a key level. Expect a downward move, but if we break upward through these levels, it signals the ABCD correction worked and trend continuation.
If we move down fast, I am careful.
War, no war, war, no war... markets moving like crazy, but technically it still makes sense. What looks random, still follows patterns.
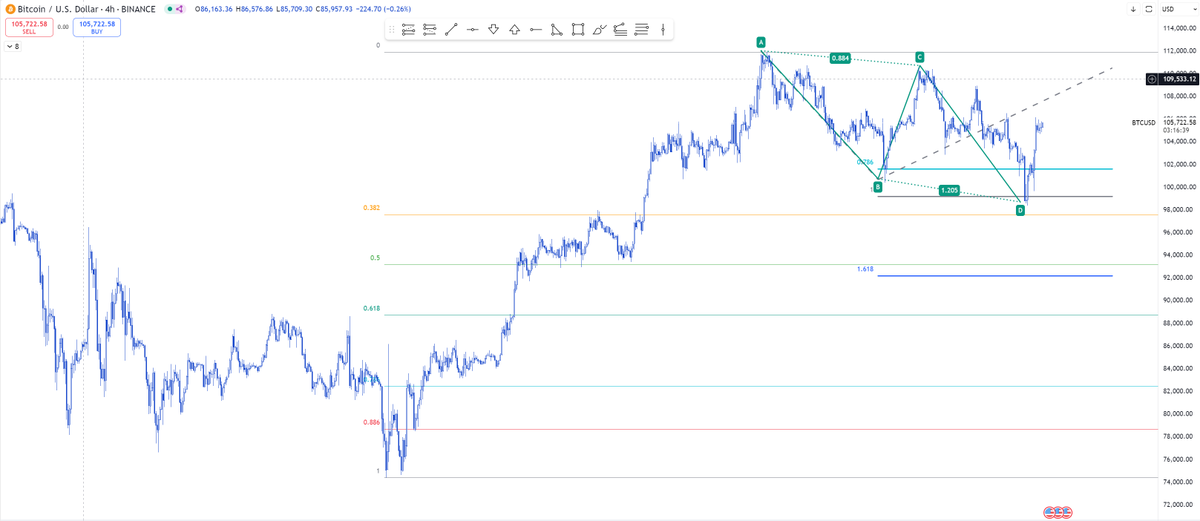
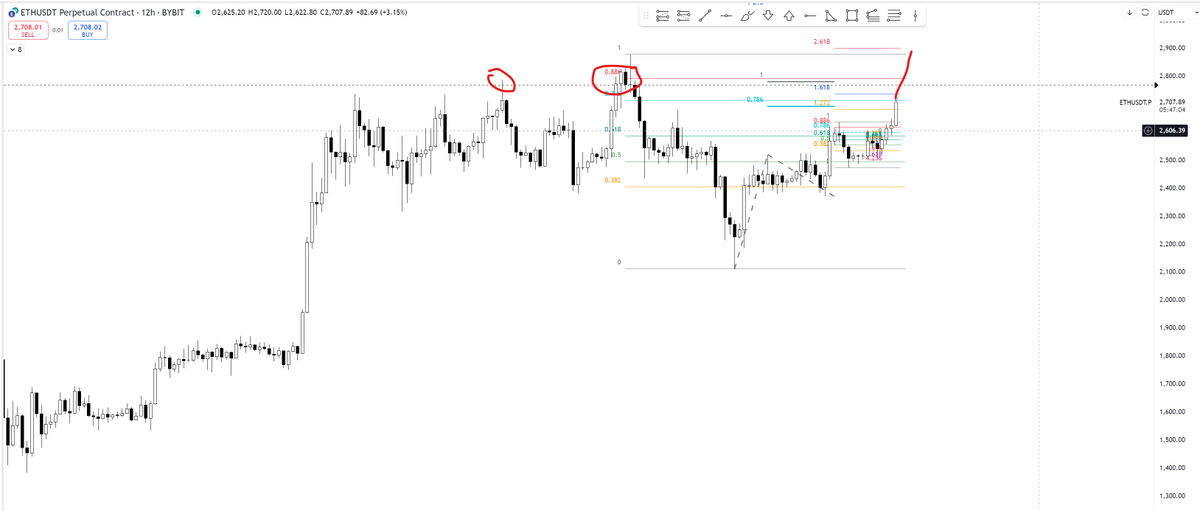
1:1 ABCD pattern on BTC, and we are getting the bounce, 50 FIB on ETH plus H/S pattern, and we are getting the bounce.
They are bouncing from my previous short positions TARGETS almost to the dolar, but will it hold? It is highly probable and I already talked about first targets of bull run in one of the tweets below.
We are at "be or not to be" levels for the bull market.
Should I say it again? "I told you so."
The scenario is playing out. As we near these levels (SOL has already hit the target), we need a strong bounce, or we're in trouble.
If we do not get bounces from here on, we are in trouble.
Here are my targets on my favourite major coins:
BTC - 98-93 K
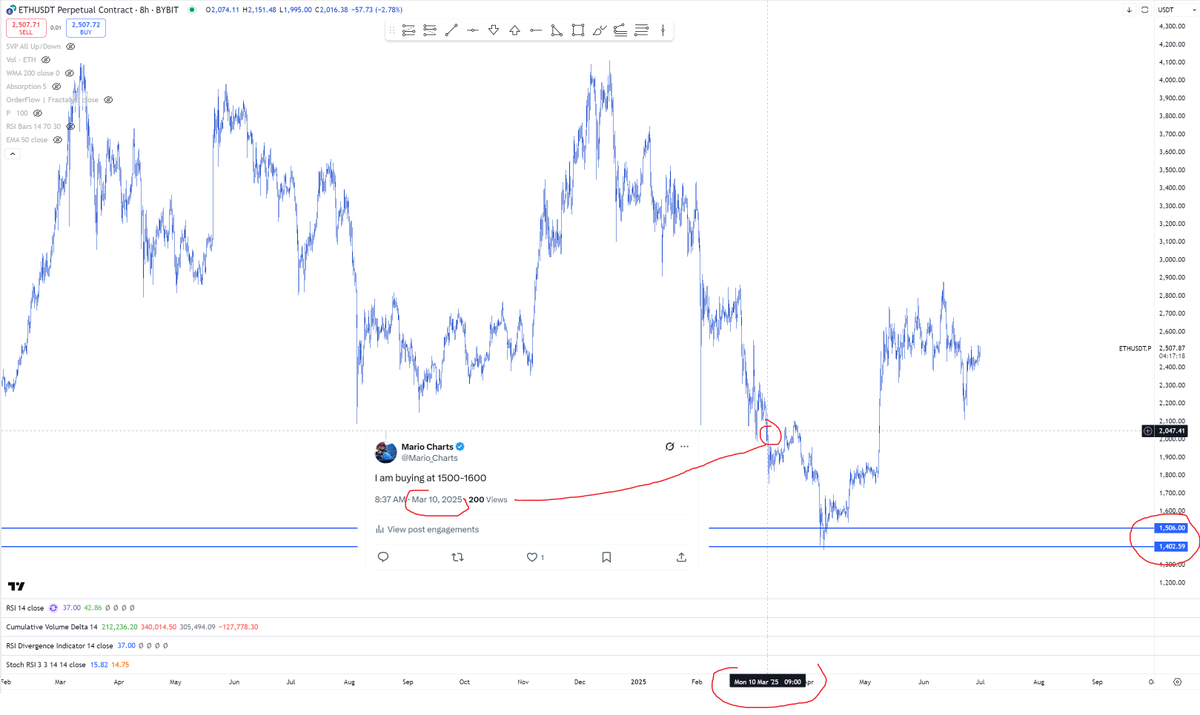
ETH - 2100
SOL - 145
If we bounce up first resistant is:
BTC - 121 K
ETH - 3000 - 3100
SOL - 210-220
Trade what you see, react instead of relying on just speculations and wishful thinking.
If I had to bet on the probabilistic basis, I would bet SHORT. 🙁
Side note: not a financial advise.
88.6 is the final Fibonacci level to break through. Statistically, if we do, we’ll reach external Fibonacci levels of 127 and 161, at least. At these levels, around 119K and 130K, expect resistance and a reaction to the downside, hopefully temporary. 😀