2026 is off to a historic start for Market Masters! 🚀
We just officially launched V1 of our app, and to say it’s been lucrative would be an understatement. We completely overhauled our platform, rolled out massive UI/UX enhancements, and the profitability our users are seeing is off the charts.
If you aren't trading with AI yet, here is exactly what you’ve been missing over the last two months. 👇
🧠 Upgraded AI/ML Pattern Detection.
Our machine learning models are firing on all cylinders. We upgraded our core pattern detection, and the two-month data speaks for itself...
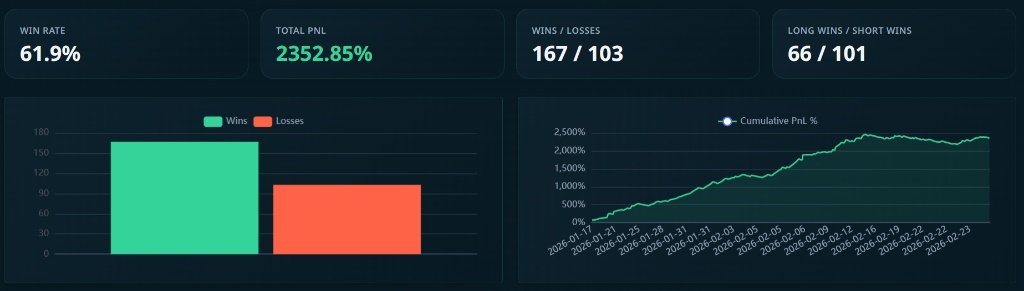
🔹 Crypto Patterns: 61.9% Win Rate with a staggering 2,352.85% Total PnL. 🚀
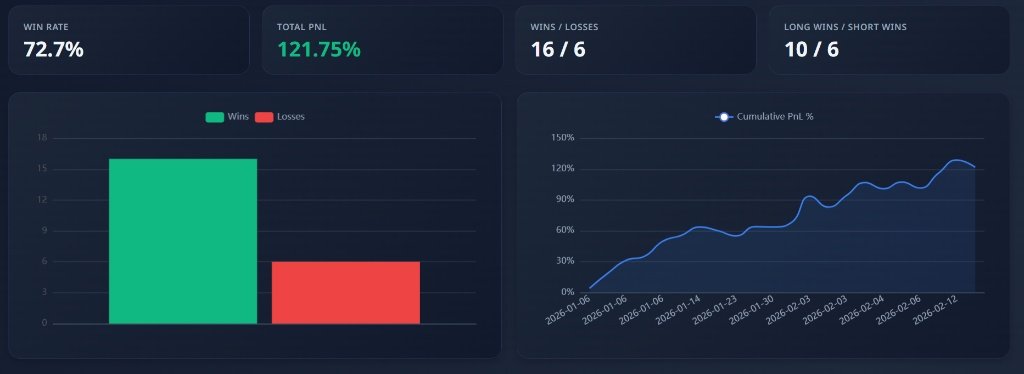
🔹 Stock Patterns: 72.7% Win Rate with 121.75% Total PnL. 📈
🔹 AI Trade Setups (Stocks): 61% Win Rate pulling in over 120% PnL. 🎯 (Peep the dashboards below - all available live on the app)
🔌 Fully Featured Market Masters API
Want to automate your edge? We just launched our comprehensive API. You now have programmatic access to EVERYTHING we offer. Trade setups, real-time patterns, deep analytics - if it's on our app, you can pull it through the API to build and automate the ultimate trading strategy.
🤖 The World's Best Trading AI Agent
We didn't just stop at signals; we built an absolute powerhouse. Meet our proprietary AI chatbot, exclusively trained on Market Masters' deep data. It is hands-down the best AI agent on the planet for stock and crypto analysis. Need custom trade setups? Complex pattern breakdowns? Elliott Wave mapping? Just ask.
💼 Orion AI Portfolio Manager
Managing your bags just got effortless. We integrated Orion AI to act as your personal portfolio manager. It inspects, analyzes, and helps you rebalance your portfolios in real-time to optimize for risk and reward.
🎮 Risk-Free Paper Trading
Want to test our AI's setups before putting real capital on the line? Our new Paper Trading ground lets you practice your stock and crypto trades entirely risk-free, anytime.
📚 The Learning Hub
Knowledge is power. We implemented a dedicated learning section so users of all levels can master trading psychology, technical analysis, and strict risk management.
🤝 Win-Win Affiliate Program
We want you to grow with us. We just rolled out our new affiliate program:
💰 Affiliates: Earn 20% recurring revenue. 💸 Referees: Get a 15% recurring discount per billing cycle.
2026 has brought incredible profits, seamless updates, and a totally leveled-up user experience. V1 is live, but we are just getting started.
Stop guessing. Start mastering. 🌐📈
#MarketMasters #AITrading #StockMarket #Crypto #TradingSignals #MachineLearning #Fintech
$bchusdt risingwedge just printed +60.2% on the 3d in 14 days
price stacked lower highs into the top line until it finally cracked and bears drove it straight down without any real bounce. classic wedge resolution.
bch sitting near 213 now after that drop.
patience on the higher timeframe setups still beats chasing every 4h fakeout.
agt ripping to $0.01599 on a 102.76 percent wick is pure micro structure again
no catalyst or sector flow just thin books getting hit on low cap volume. next real bids live right under the wick where the stack drops off fast.
this fades once early longs start booking unless volume actually builds behind it. you seeing any real bids step in or just another wick that dies quick?
equities taking a modest hit while isolated crypto microcaps explode higher tells you risk appetite isn't unified today.
esports $0.01326 up 57.39%
agt $0.06909 up 48.65%
jto $0.7947 up 42.57%
beat $2.45 down 44.12%
qqq $734.36 down 1.21%
spy $751.40 down 0.45%
this looks like the usual rotation where growth equities get clipped on generic caution and leveraged retail keeps hunting in small alt names. you seeing the same split?
traders think you need footprint charts or a paid tape feed to read order flow but the basics live in any live book with size and time prints.
price only moves when aggressive size steps in and clears levels. watch what happens on the first big prints after a quiet period. if large lots lift the ask and price holds the level for the next few candles the buyers are in control for that swing. if the same size gets absorbed on the bid and price rolls over the sellers just won the round.
- note the direction of the prints that break the recent micro range first
- check whether follow through volume appears in the same direction within the next 30 seconds to a minute
- ignore everything under 5x average print size until the book thins out
start there before you pay for anything fancier. you seeing absorption on your books this week?
$bchusdt rising wedge just printed +60.2% in 13 days on the 3d
price kept testing the upper boundary with lower highs until support finally gave out and the drop accelerated without hesitation.
bch now sits around 215-225 after the break.
watching how these higher timeframe wedges resolve once volume picks up on the breakdown tells you more than any forecast.
alts are swinging 30-60% on single names while qqq and spy grind higher with almost no conviction.
br $1.27 up 63.80%
bsb $0.7291 up 63.31%
jto $0.1122 up 42.57%
evaa $1.27 down 34.23%
qqq $743.61 up 0.95%
spy $754.56 up 0.57%
this split points to concentrated positioning and liquidity games in small caps rather than any macro shift.
crypto alts are ripping in opposite directions while qqq inches higher, a clear sign of isolated microcap rotation rather than any broad risk-on wave.
bsb $0.2047 up 63.30%
br $0.2282 up 51.27%
jto $0.7291 up 42.57%
h $0.2047 down 49.07%
clo $0.3622 down 42.12%
qqq $743.61 up 0.95%
this kind of dispersion usually fades fast once liquidity chases the next ticker.
most traders size every trade like the next one will save their account and then wonder why one bad headline nukes them.
late cycle means war noise and energy spikes can rip through leverage fast. position sizing is the only thing that lets you stay alive when the move goes against you instead of hoping it turns around.
the real rule is simple survival math over conviction.
- never risk more than one percent of total capital on any single setup even if the chart looks perfect
- cut that size in half when energy headlines start moving the tape because volatility expands fast
- add back size only after two winning trades prove the regime has calmed
bookmark this before the next macro shock hits. what size rule do you actually follow when things get choppy?
$hypeusdt (4h) - descending channel +4.3% from the breakout in 1d. members had the full alert from jun. the channel walls cracked and price ripped higher without looking back. #descendingchannel#trading
$bchusdt risingwedge just cleared +60.2% from the posted level in 12 days on the 3d
price kept rejecting at the descending top while volume dried up on each test until the wedge finally broke and bears took over without much fight back.
bch now trades in the $440 - 460 range after the drop played out.
waiting for that clean break on rising wedges still beats calling the turn early every time.
evAAusdt at 0.7112 up 90 percent while jto sits at 0.5584 and uai at 0.2996 tells the real story
the tape isn't spreading into reflation or ai rails or anything macro it's still just tagging the next low float restaking name and leaving the rest for dead
same selectivity as last week just wearing a different ticker
volume tells you whether a price move has real conviction or just drifted on thin air especially when macro shocks hit.
the middle east shock has been flipping risk appetite and liquidity fast. price can spike on headlines but without volume behind it the move usually fades fast. open interest and traded volume show if big players are actually committing or if retail is chasing shadows.
• watch volume spikes at key levels not just the price wick
• low volume rallies after shocks often reverse once liquidity thins
• rising open interest with price means new money is entering not just short covering
check the tape before the next headline whips the tape again.
$bchusdt rising wedge closed +60.2 percent off the posted level in 11 days on the 3d
price kept printing lower highs into the upper boundary until it finally cracked and bears took control without any bounce back.
bch sits around 204 to 209 now after sliding for the week.
higher timeframe wedges still reward the patient ones who wait for the actual break instead of guessing early.
these altcoin moves are pure microcap rotation with no macro spillover from energy or yields.
esports $0.4195 down 62.07%
siren $0.06187 down 54.55%
h $0.06187 up 41.27%
evaa $0.06187 up 39.34%
coai $0.06187 down 38.39%
tradoor $0.06187 up 29.90%
the tape shows flows chasing thin pockets then dumping others just as fast.
track live at https://t.co/6H5MmeRoDO
extreme funding rates don't predict tops but they flag when one side is stacked too heavy and ripe to unwind.
perps stay pinned to spot through these payments between longs and shorts. when rates stay positive for days the longs are basically paying to stay long and that crowd grows until any spark triggers the exit.
- check the rate on the exact perp you're watching not just the index average
- sustained high positive rates paired with price stalling often mark the crowded long
- negative rates flipping fast after a drop can show the short side getting trapped instead
the real tell is when rates stay elevated while volume fades. that setup rarely ends clean.
coai at 0.3695 after the 87 percent print looks like strength but it's the same thin liquidity game.
capital just left stg and siren to chase the next low float name that can still wick. this isn't rotation it's one ticker at a time getting squeezed while the rest stay dead.
siren's 73.50% freefall is the one move that makes the rest of the board look quiet this weekend.
- SIREN $0.07960 down 73.50%
- COAI $0.6248 up 67.41%
- VELVET $0.6248 down 52.82%
- JCT $0.004381 up 47.36%
- STG $0.07960 down 43.81%
- RIF $0.4736 up 36.69%
these names are moving on pure volume spikes with no obvious macro driver attached.
velvet and siren just got torched with losses north of 70 percent in a single day.
• VELVET $0.26650 down 76.25%
• SIREN $0.2022 down 74.28%
• STG $0.26650 down 37.62%
• MYX $0.2022 down 31.94%
• 1000WHY $0.000003400 down 33.33%
rif is the lone bright spot at $0.2665 up 36.96% while everything else bleeds.
you building any hedges into next week or just sitting flat?
$fheusdt (4h) - descending channel +5.0% from the breakout in 1d. members had the full alert from jun. upper line break triggered fast extension. #descendingchannel#trading
$bchusdt risingwedge just closed +60.2% in 9 days on the 3d
price stacked lower highs into the upper line until it finally snapped and bears pushed it straight down with zero pause.
most setups fail because traders jump in too early instead of waiting for that clean break.