Bloomberg Terminal runs ~$32K/yr/seat. MarketXLS runs a small fraction of that. Bloomberg has fixed-income depth, chat velocity, and an institutional execution rail we don't try to replicate. What you get back: every public-equity datapoint in Excel where your models live.
LEN 3.6% / KBH 3.0% op margins paired with LEN rev growth -13% is the entry-level demand-elasticity tell in this cycle. Both run the buyer book most exposed to mortgage rates and starter affordability. Margin compression shows up first in the entry sleeve.
NVR -14% YTD paired with 13.5% op margin and Beta 0.92 is the cohort's capital-light defensiveness paradox. Land-option model preserves margin structure even as the demand backdrop tightens. Price moved on topline expectations, not on operating-model integrity.
TOL +3% YTD on 15.1% op margin is the cleanest sleeve-outperformance read in homebuilders. Luxury / move-up tilt insulates from the entry-level demand softness pricing into KBH and LEN. Higher-ASP buyer base is less rate-sensitive at this point in the housing cycle.
Homebuilder sleeve at Wed 6/10 close. 22pts of YTD spread in one cohort: MTH +8 / TOL +3 / DHI +3 leading; LEN -12 / NVR -14 trailing. Op-margin spread as wide — TOL 15.1 / NVR 13.5 on top, KBH 3.0 / LEN 3.6 on the floor. Same =OperatingMargin() call, seven cycle reads.
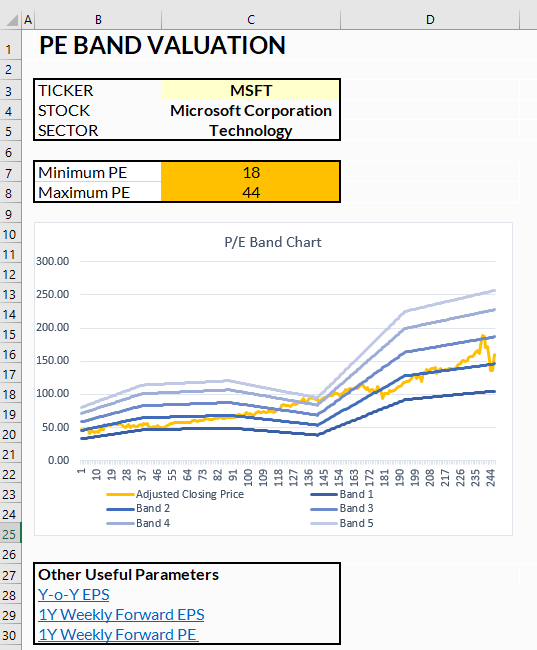
Template of the day: PE Band Valuation. Plots a stock against forward-PE multiple bands (mean +/- std-dev of its own history) so you can read where it sits in its own valuation cycle. Useful when a client asks 'is this expensive?' and 'vs what?' matters. https://t.co/ywCwY5kewy
Gordon DDM run backward: pick a yield, pick a cost of equity, back out implied growth. VZ at 6.18% / 8% cost of equity implies long-run div growth ~1.8%. T at 4.89% implies ~3.1%. Two encoded views of the same telecom franchise. Today's template runs it forward.
5Y avg yield as a rerate anchor: VZ 6.18 vs 6.12 (right at), MO 5.93 vs 7.64 (well below), T 4.89 vs 6.29 (well below). Market has compressed mega-cap dividend yields tighter than the 2021-23 yield-as-bond-proxy peak. Rates aren't doing the heavy lifting on this leg.
VZ 6.18% yield on a 67% payout and 10.3% FCF yield is one of the cleanest yield-to-coverage combos in mega-cap dividend names. FCF yield north of dividend yield by 4pts means room for buybacks layered on top of the payout. Different math than tobacco-style 88%+ payout names.
Large-cap dividend names at Tue 6/9 close. 3.9pts of yield spread inside one screen: VZ 6.2 / MO 5.9 / T 4.9 leading; KO 2.6 / JNJ 2.3 on the floor. Payout coverage swings even wider — T 37% to CVX 120%. Same =PayoutRatio() call, ten different stories.
Template of the day: Dividend Growth Model (Gordon Method). Discounts a projected dividend stream into an intrinsic value that's independent of the current multiple — a useful sanity check on names where the yield itself is doing the work. https://t.co/sPjKfCaKlN
NVDA 66% op margin paired with Beta 2.20 is one of the cleanest operating-leverage-plus-market-sensitivity combos in the index. Fwd PE 16.5x prices the leverage as already realized. On a fixed-margin franchise, when multiples compress, beta does the work.
AVGO +14% YTD at 49% op margin vs NVDA +11% at 66% — two ways to play AI infrastructure with very different unit economics. AVGO routes custom silicon + VMware ARR; NVDA monetizes the compute layer directly. Same end demand, different point on the value chain.
MSFT -15% YTD on a 46% op margin and Beta 1.10 is the cleanest multiple-compression-on-defensive-book read in mega-cap tech. Capex digestion is the rerate variable; margin and durability aren't. Different framing than the AI-leverage trade on the same income statement line.
Template of the day: Unusual Options Activity Scanner. Scan a watchlist by volume / open interest / volume-to-OI ratio to surface where institutional flow is showing up before headlines do. Useful as a sentiment overlay on names you already cover. https://t.co/2bmLVKxEaO
TSLA fwd PE 156x at 17.9x book is the opposite end of the Graham screen. Market is pricing the FSD / robotaxi / energy stack, not the car business. Car alone wouldn't carry the multiple. Different valuation framework looking at the same chassis.
F +16% YTD is the lone green legacy OEM (GM +1.4%, STLA -35%). Truck and SUV cash cows (Maverick, Bronco, Super Duty) plus the 4% dividend doing the work. Forward PE 8x reads as market re-rating restructuring forward, not waiting on the EV math to clear.
STLA at 0.33x book and 10.6% yield is the deeper Graham number. The catch: trailing EPS sits negative on a brutal FY24 carryover, so the earnings-power Graham's screen wants is still being rebuilt. Bargain on the asset base, question mark on the income.
HMC at 0.47x book, 5.0% yield, fwd PE 5.4x is the cleanest Graham Enterprising fit in autos. Combined P/E × P/B = ~2.5 — Graham's 22.5 ceiling not even on the radar. Large global brand, profitable franchise. Yen translation and JP accounting do some of the book-value math.