MRNA -131% op margin and +61% YTD is the post-COVID rebuild trade in one cell. Market is pricing pipeline option value (RSV launched, flu and BMI in late-stage trials) against COVID revenue normalization. Different valuation framework from the income statement.
ALNY +96% revenue growth and -23.8% YTD is the cleanest multiple-compression-on-growth read in biotech right now. RNAi platform stacking Onpattro/Givlaari/Oxlumo/Amvuttra approvals — fundamentals accelerating, price de-rating. Two different framings of the same revenue line.
VRTX 38% op margin / -1.4% YTD vs SRPT 49% op margin / -27% YTD is the same fat-margin number priced two different ways. CF monopoly book vs single-product gene-therapy binary read. Op margin is a number; what the market is pricing is the asset durability behind it.
US biotech at Fri close. Op margin spread: GILD 39% / VRTX 38% / AMGN 34% in the black; MRNA still -131% on revenue rebuild. YTD MRNA +61% → SRPT -27% = 88pts inside one sleeve. Same =OperatingMargin() formula, ten different unit-economics stories.
Template of the day: Portfolio comparison. Two or more portfolios on one tab — weights, exposures, returns side by side. The advisor view for model vs client, before vs after rebalance, or peer benchmarking. https://t.co/47r2F276mc
CRWD 36x P/S vs FTNT 15x P/S is the platform-consolidation premium priced in. Market is paying for Falcon's modular cross-sell (identity + cloud + log mgmt) on top of endpoint. Different revenue-quality framings on the same 'subscription revenue' line.
ZS -40% YTD with revenue still growing 25% is the cleanest multiple-compression read in cyber. Same growth, lower price — guidance cadence and competitive overhang from CRWD identity doing the work. Forward PE compressed from triple-digits to 29x — that's the de-rate.
GEN 63% op margin is the consumer-cyber subscription math at scale. Norton, Avast, LifeLock — direct-to-consumer auto-renewing subs with negligible incremental delivery cost. The two-platform cohort (consumer vs enterprise) ends up with the widest margin spread inside the sleeve.
FTNT 31% op margin in cyber isn't a SaaS-platform story — it's the network-appliance hardware-plus-software model. ASIC-accelerated FortiGate boxes shipped at gross margins north of 75%, services and renewals layered on top. Different unit economics from CRWD/NET/ZS pure-cloud.
US cyber at Thu close. Op margin tells the Stock Health Checkup story: GEN 63% / FTNT 31% / OKTA 7% in the black; CRWD, PANW, NET, ZS, S still scaling at -2% to -29%. YTD spread FTNT +89% → ZS -40% = 129pts inside one sleeve. Formula: =OperatingMargin().
Template of the day: Stock Health Checkup. EPS growth, revenue/net income trends, margins and valuation ratios — all benchmarked vs industry peers. The single-name diagnostic that pairs with Altman Z, Beneish M, Piotroski F at the portfolio level. https://t.co/OaT99fP3HZ
FIS 7.9x trail / PYPL 8.0x trail are single-digit-PE payments processors — the cohort's deep-value bucket. F-Score read: profitability still ~16-18% op margins, so the math holds. The discount is on growth trajectory and competitive position, not earnings quality.
XYZ +5.9% YTD despite -2.6% op margin is the F-Score 'low score, high multiple' divergence. Market pricing Cash App network growth and Bitcoin treasury angle, not current GAAP profitability. Two different valuation frameworks looking at the same income statement.
V 67% / MA 61% op margins are what F-Score profitability looks like in practice. Two-sided network: fixed cost in switches and licensing, txn volume scales on top. Every incremental swipe drops mostly to op income. That's the quality the score is trying to capture.
AI stock pickers spit out a number. That's not analysis — that's the output of analysis. The actual work is running Piotroski F, Altman Z, Beneish M against five years of 10-K footnotes. AI helps you read faster. It doesn't replace the math.
US payments & fintech at Wed close. Op margin spread is the F-Score read: V 67% / MA 61% vs SOFI 18% / FIS 16% / XYZ -2.6%. Networks down 11-19% YTD, processors 15-39%. Only XYZ green (+5.9%). Formula: =OperatingMargin().
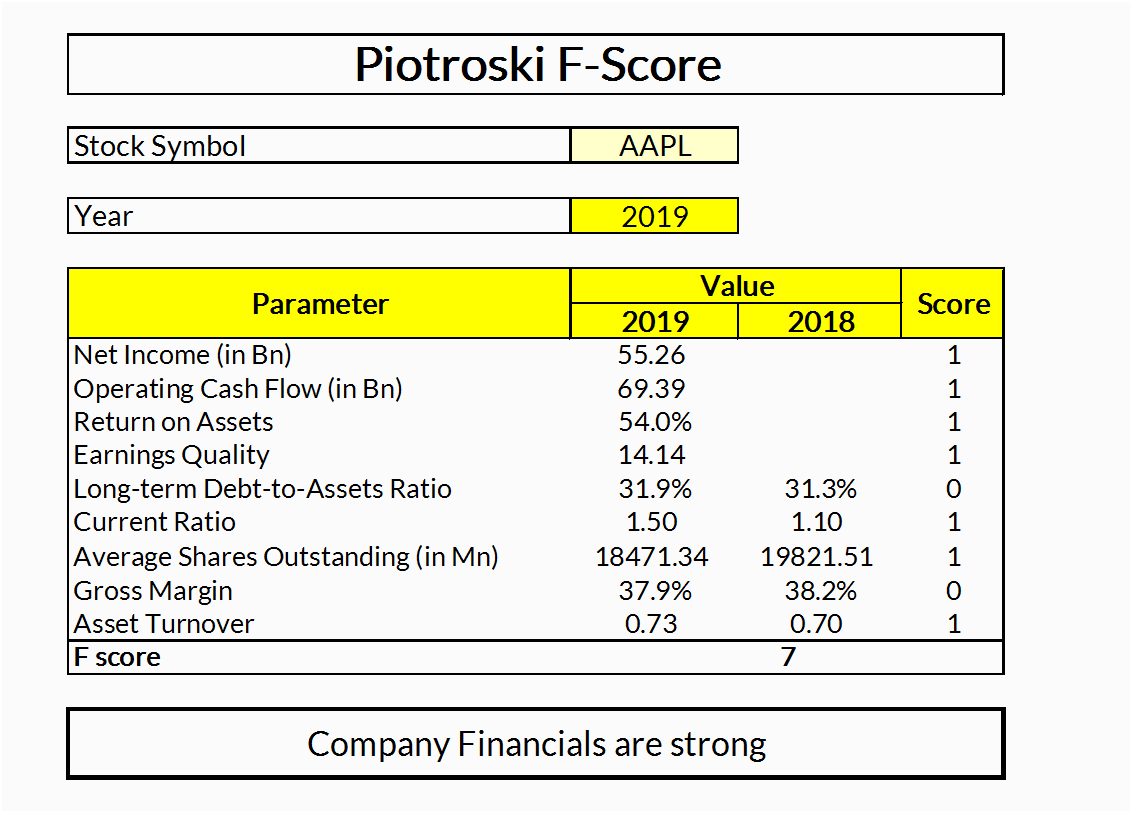
Template of the day: Piotroski F-Score. 9-criteria scorecard for financial strength — profitability, leverage, liquidity, operating efficiency. Score 0-9. Pairs with Altman Z and Beneish M to close the forensic due diligence stack. https://t.co/6kJWavYSYI
BLK -6.1% YTD vs alt cohort -22% to -30% is the passive/scale resilience tell inside asset management. Fee mix on $11T+ AUM does heavy lifting through cycles; alt-mgr P&L runs on capital activity. Same sector, different beta to the rate/credit cycle.
OWL 9.14% yield / 10.2x fwd PE is BDC/credit-fund dispersion at the widest. -29.8% YTD reflects net-investment-income pressure as direct-lending spreads compress, not payout impairment. Single-digit fwd PE says market is pricing the income line through.
BEN +32.3% YTD is the cleanest contrarian print in active management. Western Asset workout largely priced through; question is whether the franchise re-stabilizes flow. 10.5x fwd PE / 4.24% yield reads as durable cash-return profile, not growth re-rating.