🚀📈 𝐌𝐨𝐫𝐧𝐢𝐧𝐠 𝐒𝐭𝐚𝐫 𝐂𝐚𝐧𝐝𝐥𝐞𝐬𝐭𝐢𝐜𝐤 𝐏𝐚𝐭𝐭𝐞𝐫𝐧 𝐓𝐡𝐚𝐭 𝐂𝐚𝐧 𝐅𝐨𝐫𝐞𝐜𝐚𝐬𝐭 𝐓𝐡𝐞 𝐍𝐞𝐱𝐭 𝐁𝐢𝐠 𝐌𝐚𝐫𝐤𝐞𝐭 𝐑𝐚𝐥𝐥𝐲 📈🚀
✨𝐓𝐡𝐞 𝐒𝐞𝐜𝐫𝐞𝐭 𝐁𝐮𝐥𝐥𝐢𝐬𝐡 𝐒𝐢𝐠𝐧𝐚𝐥 𝐏𝐫𝐨 𝐓𝐫𝐚𝐝𝐞𝐫𝐬 𝐖𝐚𝐭𝐜𝐡✨
The Morning Star Candlestick Pattern is one of the most reliable bullish reversal patterns in technical analysis. It appears after a strong downtrend and signals that sellers are losing momentum while buyers are beginning to take control. The pattern is made up of three candles. The first candle is a large bearish candle showing heavy selling pressure. The second candle is a small candle that represents market indecision and weakening bearish strength. The third candle is a strong bullish candle that closes above the midpoint of the first candle and confirms the possibility of a trend reversal. Professional traders increase the probability of success by combining this pattern with support zones, higher trading volume, RSI, MACD, moving averages, and price action confirmation. Entering only after the third candle closes helps avoid false signals. A stop loss below the pattern low and disciplined risk management are essential for protecting capital. Understanding this pattern can help traders identify early buying opportunities and improve decision making in stocks, forex, commodities, and cryptocurrency markets.
💹𝐇𝐨𝐰 𝐓𝐨 𝐓𝐫𝐚𝐝𝐞 𝐓𝐡𝐢𝐬 𝐏𝐚𝐭𝐭𝐞𝐫𝐧 𝐋𝐢𝐤𝐞 𝐀 𝐏𝐫𝐨💹
✅ Confirm a clear downtrend before the pattern appears
✅ Identify the three candle formation correctly
✅ Wait for the bullish confirmation candle to close
✅ Check for rising trading volume
✅ Confirm with RSI or MACD indicators
✅ Enter only after confirmation
✅ Place stop loss below the lowest candle
✅ Book profits near the next resistance zone
✅ Maintain proper risk reward ratio
✅ Stay disciplined and avoid emotional decisions
🔥𝐄𝐯𝐞𝐫𝐲 𝐬𝐮𝐜𝐜𝐞𝐬𝐬𝐟𝐮𝐥 𝐭𝐫𝐚𝐝𝐞𝐫 𝐟𝐨𝐥𝐥𝐨𝐰𝐬 𝐚 𝐩𝐥𝐚𝐧, 𝐧𝐨𝐭 𝐞𝐦𝐨𝐭𝐢𝐨𝐧𝐬. 𝐈𝐟 𝐭𝐡𝐢𝐬 𝐩𝐨𝐬𝐭 𝐡𝐞𝐥𝐩𝐞𝐝 𝐲𝐨𝐮, 𝐬𝐡𝐚𝐫𝐞 𝐢𝐭 𝐰𝐢𝐭𝐡 𝐲𝐨𝐮𝐫 𝐟𝐫𝐢𝐞𝐧𝐝𝐬 𝐨𝐧 𝐓𝐰𝐢𝐭𝐭𝐞𝐫, 𝐅𝐚𝐜𝐞𝐛𝐨𝐨𝐤, 𝐚𝐧𝐝 𝐈𝐧𝐬𝐭𝐚𝐠𝐫𝐚𝐦 𝐚𝐧𝐝 𝐡𝐞𝐥𝐩 𝐦𝐨𝐫𝐞 𝐭𝐫𝐚𝐝𝐞𝐫𝐬 𝐦𝐚𝐬𝐭𝐞𝐫 𝐩𝐫𝐢𝐜𝐞 𝐚𝐜𝐭𝐢𝐨𝐧 𝐭𝐫𝐚𝐝𝐢𝐧𝐠. 🔥
Twitter: https://t.co/KGM0sHlFr2
#MorningStar #MorningStarPattern #MorningStarCandlestick #CandlestickPattern #BullishReversal #TechnicalAnalysis #PriceAction #PriceActionTrading #CandlestickTrading #ChartPatterns #StockMarket #ShareMarket #IndianStockMarket #Nifty50 #BankNifty #Sensex #IntradayTrading #SwingTrading #DayTrading #PositionalTrading #StockTrading #ForexTrading #CryptoTrading #OptionsTrading #FuturesTrading #SupportResistance #RSI #MACD #MovingAverage #VolumeAnalysis #Breakout #TrendReversal #TradingStrategy #TradingTips #TradingEducation #LearnTrading #MarketAnalysis #Investor #TraderLife #FinancialFreedom #WealthCreation #TradeSmart #InvestSmart #MarketPulse247 #StockMarketIndia #ChartAnalysis #TradingCommunity #BullishSignals
🚀📈 𝐌𝐨𝐫𝐧𝐢𝐧𝐠 𝐒𝐭𝐚𝐫 𝐂𝐚𝐧𝐝𝐥𝐞𝐬𝐭𝐢𝐜𝐤 𝐏𝐚𝐭𝐭𝐞𝐫𝐧 𝐓𝐡𝐚𝐭 𝐂𝐨𝐮𝐥𝐝 𝐒𝐢𝐠𝐧𝐚𝐥 𝐘𝐨𝐮𝐫 𝐍𝐞𝐱𝐭 𝐁𝐢𝐠 𝐖𝐢𝐧 📈🚀
✨𝐖𝐡𝐲 𝐓𝐫𝐚𝐝𝐞𝐫𝐬 𝐂𝐚𝐧𝐧𝐨𝐭 𝐈𝐠𝐧𝐨𝐫𝐞 𝐓𝐡𝐢𝐬 𝐏𝐚𝐭𝐭𝐞𝐫✨
The Morning Star Candlestick Pattern is one of the strongest bullish reversal signals used by professional traders across stocks, forex, commodities, and cryptocurrencies. It appears after a sustained downtrend and often signals that selling pressure is fading while buyers are beginning to regain control. The pattern is formed with three candles. The first is a strong bearish candle showing aggressive selling. The second is a small candle that reflects uncertainty and market indecision. The third is a powerful bullish candle that closes above the midpoint of the first candle, confirming that buyers have stepped back into the market. Successful traders never rely on this pattern alone. They combine it with higher trading volume, RSI divergence, MACD confirmation, support zones, and moving averages to improve accuracy. Waiting for confirmation before entering a trade helps reduce false signals and improves consistency. Every trade should include proper risk management with a stop loss below the lowest point of the pattern and a realistic profit target near the next resistance level. Mastering this pattern can help traders identify high probability reversal opportunities before a new bullish trend gains momentum.
Twitter: https://t.co/KGM0sHlFr2
💹𝐒𝐦𝐚𝐫𝐭 𝐓𝐫𝐚𝐝𝐢𝐧𝐠 𝐂𝐡𝐞𝐜𝐤𝐥𝐢𝐬𝐭💹
🔹Identify a strong downtrend before the pattern forms
🔹Confirm all three candles are clearly visible
🔹Wait for the bullish confirmation candle to close
🔹Check for higher trading volume
🔹Use RSI or MACD for confirmation
🔹Buy only after confirmation
🔹Place stop loss below the pattern low
🔹Book profits near resistance levels
🔹Follow strict risk management
🔹Stay patient and avoid emotional trading
🔥𝐄𝐯𝐞𝐫𝐲 𝐠𝐫𝐞𝐚𝐭 𝐭𝐫𝐚𝐝𝐞𝐫 𝐥𝐞𝐚𝐫𝐧𝐬 𝐭𝐨 𝐫𝐞𝐚𝐝 𝐜𝐡𝐚𝐫𝐭𝐬 𝐛𝐞𝐟𝐨𝐫𝐞 𝐫𝐞𝐚𝐝𝐢𝐧𝐠 𝐧𝐞𝐰𝐬. 𝐈𝐟 𝐲𝐨𝐮 𝐟𝐨𝐮𝐧𝐝 𝐭𝐡𝐢𝐬 𝐮𝐬𝐞𝐟𝐮𝐥, 𝐬𝐡𝐚𝐫𝐞 𝐢𝐭 𝐰𝐢𝐭𝐡 𝐲𝐨𝐮𝐫 𝐟𝐞𝐥𝐥𝐨𝐰 𝐭𝐫𝐚𝐝𝐞𝐫𝐬 𝐨𝐧 𝐓𝐰𝐢𝐭𝐭𝐞𝐫, 𝐅𝐚𝐜𝐞𝐛𝐨𝐨𝐤, 𝐚𝐧𝐝 𝐈𝐧𝐬𝐭𝐚𝐠𝐫𝐚𝐦. 𝐊𝐧𝐨𝐰𝐥𝐞𝐝𝐠𝐞 𝐠𝐫𝐨𝐰𝐬 𝐰𝐡𝐞𝐧 𝐢𝐭 𝐢𝐬 𝐬𝐡𝐚𝐫𝐞𝐝. 🔥
Twitter: https://t.co/KGM0sHlFr2
#MorningStar #MorningStarPattern #MorningStarCandlestick #CandlestickPattern #CandlestickTrading #BullishReversal #TechnicalAnalysis #PriceAction #PriceActionTrading #ChartPatterns #StockMarket #ShareMarket #IndianStockMarket #Nifty50 #BankNifty #Sensex #IntradayTrading #DayTrading #SwingTrading #PositionalTrading #StockTrading #ForexTrading #CryptoTrading #OptionsTrading #FuturesTrading #SupportResistance #RSI #MACD #MovingAverage #VolumeAnalysis #BreakoutTrading #TrendReversal #TradingStrategy #TradingTips #LearnTrading #TradingEducation #MarketAnalysis #Investor #TraderLife #WealthCreation #FinancialFreedom #MarketPulse247 #Stocks #InvestSmart #TradeSmart #Bullish #ChartAnalysis #TradingCommunity
📈🔥 𝐌𝐨𝐫𝐧𝐢𝐧𝐠 𝐒𝐭𝐚𝐫 𝐏𝐚𝐭𝐭𝐞𝐫𝐧 🔥📈
✨💹 𝐓𝐡𝐞 𝐁𝐮𝐥𝐥𝐢𝐬𝐡 𝐑𝐞𝐯𝐞𝐫𝐬𝐚𝐥 𝐄𝐯𝐞𝐫𝐲 𝐓𝐫𝐚𝐝𝐞𝐫 𝐒𝐡𝐨𝐮𝐥𝐝 𝐊𝐧𝐨𝐰 💹✨
The Morning Star candlestick pattern is one of the most trusted bullish reversal signals in technical analysis. It usually appears after a strong downtrend and often indicates that sellers are losing control while buyers are preparing to take over. The pattern consists of three candles. The first candle is a large bearish candle showing strong selling pressure. The second candle is a small bodied candle that reflects market indecision and weakening bearish momentum. The third candle is a strong bullish candle that closes above the midpoint of the first candle, confirming that buyers have regained strength. Smart traders wait for confirmation through higher trading volume, a breakout above resistance, or additional bullish indicators before entering a trade. Combining the Morning Star with RSI, MACD, moving averages, or support zones significantly improves trade accuracy. Risk management remains essential because no chart pattern guarantees success. Always place a stop loss below the pattern low and maintain a favorable risk reward ratio. Learning to identify this powerful setup can help traders capture trend reversals early and improve consistency in both swing trading and intraday trading.
Twitter: https://t.co/KGM0sHlFr2
🚀📊 𝐇𝐨𝐰 𝐓𝐨 𝐓𝐫𝐚𝐝𝐞 𝐓𝐡𝐞 𝐌𝐨𝐫𝐧𝐢𝐧𝐠 𝐒𝐭𝐚𝐫 𝐏𝐚𝐭𝐭𝐞𝐫𝐧 📊🚀
1️⃣ Identify a clear downtrend before the pattern forms.
2️⃣ Confirm the three candle structure carefully.
3️⃣ Wait for the third bullish candle to close.
4️⃣ Look for increased trading volume.
5️⃣ Confirm with RSI or MACD divergence.
6️⃣ Enter after breakout confirmation.
7️⃣ Place stop loss below the lowest candle.
8️⃣ Target the next resistance level.
9️⃣ Follow proper risk management.
🔟 Never trade based on one indicator alone.
Twitter: https://t.co/KGM0sHlFr2
#MorningStar #MorningStarPattern #BullishReversal #CandlestickPattern #CandlestickTrading #TechnicalAnalysis #PriceAction #StockMarket #ShareMarket #IndianStockMarket #Nifty50 #BankNifty #Sensex #Intraday #DayTrading #SwingTrading #PositionalTrading #TradingStrategy #TradingTips #StockTrading #ForexTrading #CryptoTrading #SupportAndResistance #RSI #MACD #MovingAverage #VolumeAnalysis #Breakout #TrendReversal #ChartPatterns #MarketAnalysis #Investing #TraderLife #FinancialEducation #LearnTrading #OptionsTrading #FuturesTrading #EquityMarket #PriceActionTrading #TradingEducation #StockCharts #MarketPulse247 #StockMarketIndia #BullishPattern #TradeSmart #InvestSmart #WealthCreation #TradingCommunity
🚨📉 𝗦𝗛𝗢𝗢𝗧𝗜𝗡𝗚 𝗦𝗧𝗔𝗥 𝗖𝗔𝗡𝗗𝗟𝗘𝗦𝗧𝗜𝗖𝗞 𝗣𝗔𝗧𝗧𝗘𝗥𝗡 ⭐⚠️ 𝗔 𝗣𝗢𝗪𝗘𝗥𝗙𝗨𝗟 𝗕𝗘𝗔𝗥𝗜𝗦𝗛 𝗥𝗘𝗩𝗘𝗥𝗦𝗔𝗟 𝗦𝗜𝗚𝗡𝗔𝗟
✨🔍 𝗪𝗵𝘆 𝗧𝗿𝗮𝗱𝗲𝗿𝘀 𝗦𝗵𝗼𝘂𝗹𝗱 𝗡𝗲𝘃𝗲𝗿 𝗜𝗴𝗻𝗼𝗿𝗲 𝗜𝘁
The Shooting Star candlestick is one of the most reliable bearish reversal patterns in technical analysis when it appears after a strong uptrend. It forms when buyers push prices sharply higher during the trading session but fail to hold those gains as sellers step in aggressively before the close. The candle closes near its opening price with a long upper shadow and a small real body. This price action reveals that bullish momentum is weakening and sellers are beginning to gain control. However successful traders never enter a trade based on this candle alone. They always wait for confirmation through the next bearish candle breaking below the Shooting Star low while confirming higher selling volume and nearby resistance. Patience helps traders avoid false signals and improves the probability of successful trades. Understanding market context trend strength and price structure makes this pattern even more powerful for swing traders and positional investors.
📊💡 𝗛𝗼𝘄 𝗧𝗼 𝗧𝗿𝗮𝗱𝗲 𝗜𝘁 𝗟𝗶𝗸𝗲 𝗔 𝗣𝗿𝗼
A disciplined trading plan is essential when using the Shooting Star pattern. Enter a short trade only after the confirmation candle closes below the pattern support level. Place the stop loss just above the high of the Shooting Star because a move above that level invalidates the bearish setup. Always define your risk before entering any trade and target the next important support zone for profit booking. Combine this pattern with indicators such as RSI MACD moving averages trendlines volume analysis and resistance levels to increase accuracy. Avoid taking trades when the overall market trend remains strongly bullish without confirmation. Remember that no candlestick pattern guarantees success but consistent risk management and patience can significantly improve long term trading performance. Mastering this classic reversal signal can help traders identify high probability selling opportunities while protecting capital from emotional decisions.
✅🔥 𝗖𝗢𝗡𝗖𝗟𝗨𝗦𝗜𝗢𝗡
The Shooting Star is not just a candlestick but a warning that bullish strength may be fading. Wait for confirmation manage your risk wisely and always trade with the trend instead of emotions. Consistency and discipline are the real secrets to long term success in the stock market.
Follow for more daily stock market education and professional technical analysis.
X (Twitter): https://t.co/KGM0sHlFr2
#StockMarket #Trading #TechnicalAnalysis #Candlestick #ShootingStar #CandlestickPattern #PriceAction #SwingTrading #Intraday #DayTrading #StockMarketIndia #IndianStockMarket #Nifty50 #BankNifty #Sensex #Investing #Trader #TradingEducation #StockTrading #MarketAnalysis #ChartPatterns #RiskManagement #StopLoss #TradingStrategy #LearnTrading #SupportResistance #Bearish #MarketPulse247 #Finance #Investment #WealthCreation #Equity #Stocks #TradingTips #FinancialFreedom #TrendReversal #VolumeAnalysis #RSI #MACD #PriceChart #StockMarketLearning #TechnicalTrader #MarketUpdate #StockEducation #ChartAnalysis #MomentumTrading #StockInvesting #MarketInsights
🚨📉 𝗦𝗛𝗢𝗢𝗧𝗜𝗡𝗚 𝗦𝗧𝗔𝗥 𝗔𝗟𝗘𝗥𝗧 ⚠️ 𝗧𝗛𝗘 𝗕𝗘𝗔𝗥𝗜𝗦𝗛 𝗦𝗜𝗚𝗡𝗔𝗟 𝗘𝗩𝗘𝗥𝗬 𝗧𝗥𝗔𝗗𝗘𝗥 𝗠𝗨𝗦𝗧 𝗞𝗡𝗢𝗪! 🔥
📌Why Smart Traders Never Ignore a Shooting Star Candle
The Shooting Star candlestick is one of the strongest bearish reversal patterns in technical analysis. It usually appears after a strong uptrend and signals that buyers initially pushed prices higher but failed to maintain control. Sellers entered aggressively and forced the price back near the opening level, creating a long upper shadow with a small real body near the low. This candle reflects rejection at higher prices and warns traders that bullish momentum may be weakening. However, never trade based on a single candle alone. Always wait for confirmation from the next candle closing below the Shooting Star low. Combine this pattern with resistance zones, RSI overbought conditions, volume expansion and bearish divergence to improve accuracy. Risk management remains the key to successful trading because no setup offers a one hundred percent success rate. Professional traders focus on probability rather than prediction and patiently wait for high quality confirmations before entering any trade.
Twitter: https://t.co/KGM0sHlFr2
📈How to Trade the Shooting Star Like a Professional
Identify a strong uptrend before looking for the Shooting Star pattern. Ensure the candle has a long upper shadow that is at least twice the body size with little or no lower shadow. Wait for the next candle to confirm the reversal by closing below the Shooting Star low. Place your stop loss above the candle high and aim for logical support levels while maintaining a healthy risk reward ratio. Avoid taking trades during low volume or sideways markets because false signals become more frequent. Consistency comes from following your trading plan and managing emotions instead of chasing every market move. Mastering this single candlestick pattern can significantly improve your trade selection and help you avoid buying near market tops.
Twitter: https://t.co/KGM0sHlFr2
💥𝗖𝗢𝗡𝗖𝗟𝗨𝗦𝗜𝗢𝗡💥
The Shooting Star is not just a candlestick pattern. It is a powerful warning that market sentiment may be shifting from bullish to bearish. Use confirmation, discipline and proper risk management to turn this pattern into a high probability trading opportunity. Learn continuously, trade wisely and protect your capital.
Twitter: https://t.co/KGM0sHlFr2
#ShootingStar #CandlestickPattern #TechnicalAnalysis #StockMarket #Trading #PriceAction #BearishReversal #ChartPatterns #CandlestickTrading #SwingTrading #DayTrading #Intraday #StockTrader #Investing #Nifty #BankNifty #IndianStockMarket #Stocks #Equity #MarketAnalysis #TradingEducation #LearnTrading #TradeSmart #RiskManagement #SupportAndResistance #RSI #VolumeAnalysis #TrendReversal #TradingStrategy #PriceActionTrading #StockEducation #Finance #MarketPulse247 #StockCharts #TraderLife #TradingCommunity #BullMarket #BearMarket #MomentumTrading #CapitalMarkets #FinancialFreedom #WealthCreation #Investor #ChartAnalysis #TradingTips #MarketInsights #TechnicalTrader #IndianTraders
🚨𝐇𝐀𝐌𝐌𝐄𝐑 𝐕𝐒 𝐇𝐀𝐍𝐆𝐈𝐍𝐆 𝐌𝐀𝐍🚨
🔥𝐃𝐎 𝐘𝐎𝐔 𝐊𝐍𝐎𝐖 𝐓𝐇𝐄 𝐃𝐈𝐅𝐅𝐄𝐑𝐄𝐍𝐂𝐄❓
1️⃣ Hammer Pattern
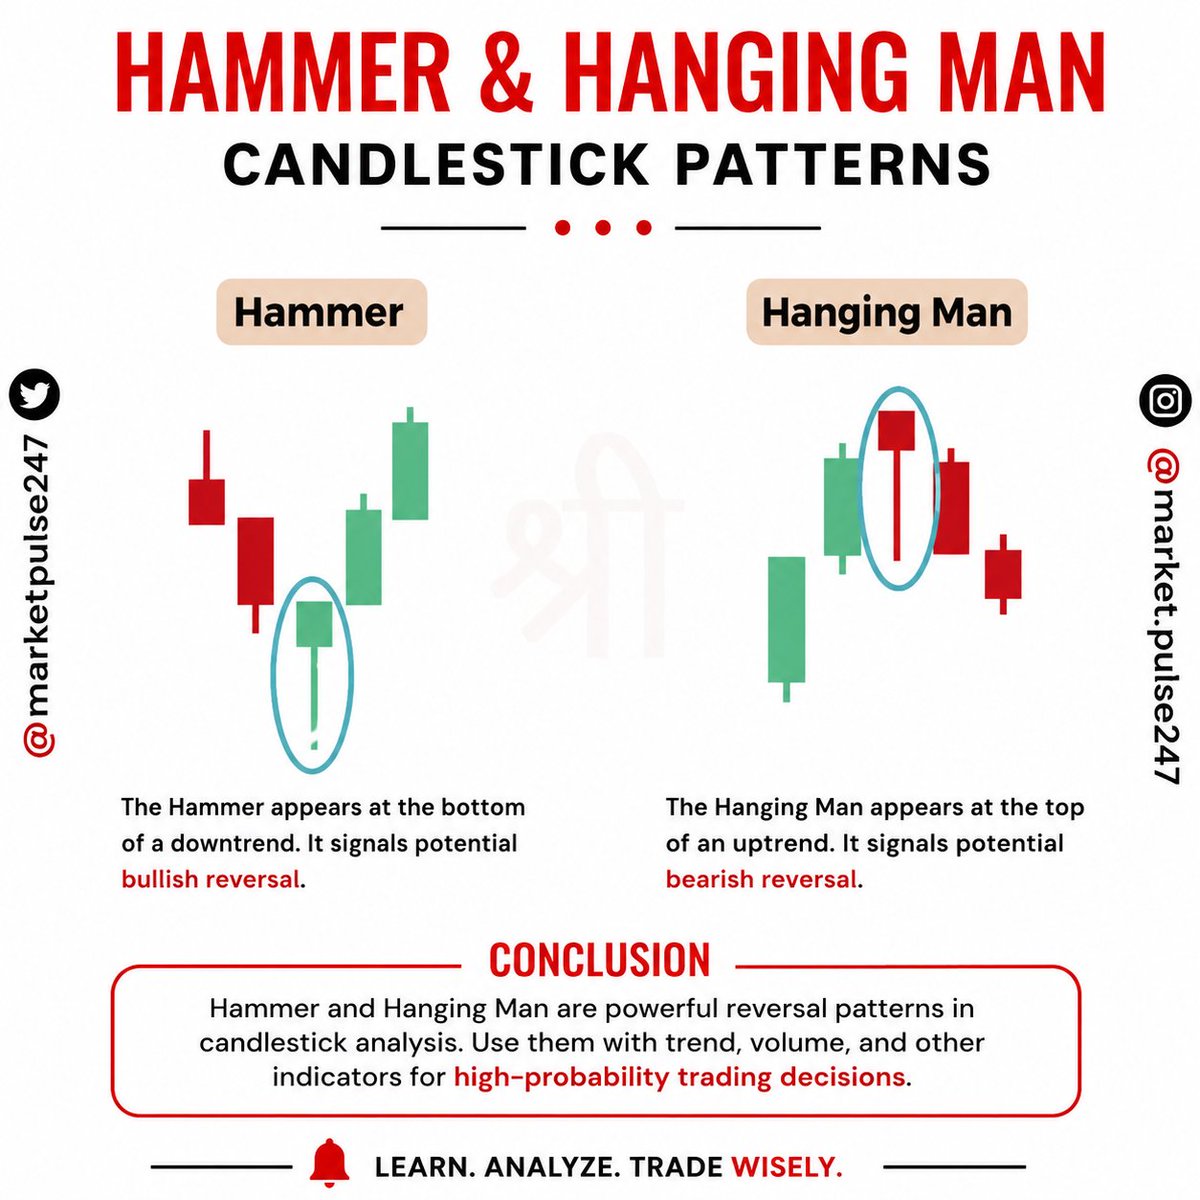
The Hammer is one of the strongest bullish reversal candlestick patterns. It usually forms after a prolonged downtrend and signals that sellers are losing control while buyers are beginning to step in. Although the candle has a small real body near the top, the long lower shadow reveals that prices were pushed significantly lower before buyers managed to recover most of the losses by the close. This shift in momentum often indicates that the market is preparing for a possible upward reversal. However, traders should never rely on the Hammer alone. Wait for confirmation through a bullish candle, rising trading volume, or support from indicators such as RSI, Moving Averages, or MACD. Entering only after confirmation helps improve the probability of success while reducing unnecessary risk.
2️⃣ Hanging Man Pattern
The Hanging Man looks almost identical to the Hammer but carries a completely different meaning because it appears after a strong uptrend. This pattern warns that buyers may be losing strength and sellers are starting to enter the market. The long lower shadow shows that sellers pushed prices sharply lower during the session, even though buyers managed to recover before the close. This hidden weakness can be an early warning of a bearish reversal. Smart traders wait for confirmation with the next bearish candle, declining momentum, or increased selling volume before taking any short position or booking profits. Understanding the market trend before interpreting this candle is the key to avoiding false trading signals and improving overall decision making.
Twitter: https://t.co/KGM0sHlFr2
3️⃣ Key Takeaway
The biggest mistake beginners make is assuming the Hammer and Hanging Man are the same because they look identical. In reality, location is everything. A Hammer at the bottom of a downtrend suggests a bullish reversal, while a Hanging Man at the top of an uptrend warns of a bearish reversal. Always combine candlestick patterns with trend analysis, support and resistance levels, volume, and proper risk management. No single pattern guarantees success, but using confirmation can significantly improve trading accuracy and protect your capital over the long term.
Twitter: https://t.co/KGM0sHlFr2
📌𝐂𝐎𝐍𝐂𝐋𝐔𝐒𝐈𝐎𝐍
Hammer and Hanging Man are among the most reliable reversal candlestick patterns when used correctly. Successful traders never trade based on candle shape alone. They first identify the prevailing trend, wait for confirmation, and then manage risk with disciplined stop losses and position sizing. Consistency in trading comes from following a proven process rather than chasing every market move. Learn the psychology behind every candlestick, practice on historical charts, and let confirmation guide your entries instead of emotions.
Twitter: https://t.co/KGM0sHlFr2
#HammerPattern #HangingMan #CandlestickPatterns #CandlestickTrading #PriceAction #TechnicalAnalysis #StockMarket #Trading #Investing #SwingTrading #DayTrading #Intraday #Nifty #BankNifty #IndianStockMarket #MarketAnalysis #TradingStrategy #Bullish #Bearish #SupportResistance #ChartPatterns #RiskManagement #VolumeAnalysis #RSI #MACD #MovingAverage #TrendTrading #StockTrader #TradingEducation #LearnTrading #MarketPulse #Equity #OptionsTrading #FuturesTrading #ChartReading #SmartMoney #TradeSmart #Investor #Finance #WealthCreation #StockCharts #TradingTips #StockAnalysis #MarketLearning #FinancialFreedom #TraderLife #MarketPulse247 #IndianTraders
🚨𝐇𝐀𝐌𝐌𝐄𝐑 𝐕𝐒 𝐇𝐀𝐍𝐆𝐈𝐍𝐆 𝐌𝐀𝐍🚨
🔥𝐃𝐎 𝐘𝐎𝐔 𝐊𝐍𝐎𝐖 𝐓𝐇𝐄 𝐃𝐈𝐅𝐅𝐄𝐑𝐄𝐍𝐂𝐄❓
1️⃣ Hammer Pattern
The Hammer is one of the strongest bullish reversal candlestick patterns. It usually forms after a prolonged downtrend and signals that sellers are losing control while buyers are beginning to step in. Although the candle has a small real body near the top, the long lower shadow reveals that prices were pushed significantly lower before buyers managed to recover most of the losses by the close. This shift in momentum often indicates that the market is preparing for a possible upward reversal. However, traders should never rely on the Hammer alone. Wait for confirmation through a bullish candle, rising trading volume, or support from indicators such as RSI, Moving Averages, or MACD. Entering only after confirmation helps improve the probability of success while reducing unnecessary risk.
2️⃣ Hanging Man Pattern
The Hanging Man looks almost identical to the Hammer but carries a completely different meaning because it appears after a strong uptrend. This pattern warns that buyers may be losing strength and sellers are starting to enter the market. The long lower shadow shows that sellers pushed prices sharply lower during the session, even though buyers managed to recover before the close. This hidden weakness can be an early warning of a bearish reversal. Smart traders wait for confirmation with the next bearish candle, declining momentum, or increased selling volume before taking any short position or booking profits. Understanding the market trend before interpreting this candle is the key to avoiding false trading signals and improving overall decision making.
Twitter: https://t.co/KGM0sHlFr2
3️⃣ Key Takeaway
The biggest mistake beginners make is assuming the Hammer and Hanging Man are the same because they look identical. In reality, location is everything. A Hammer at the bottom of a downtrend suggests a bullish reversal, while a Hanging Man at the top of an uptrend warns of a bearish reversal. Always combine candlestick patterns with trend analysis, support and resistance levels, volume, and proper risk management. No single pattern guarantees success, but using confirmation can significantly improve trading accuracy and protect your capital over the long term.
Twitter: https://t.co/KGM0sHlFr2
📌𝐂𝐎𝐍𝐂𝐋𝐔𝐒𝐈𝐎𝐍
Hammer and Hanging Man are among the most reliable reversal candlestick patterns when used correctly. Successful traders never trade based on candle shape alone. They first identify the prevailing trend, wait for confirmation, and then manage risk with disciplined stop losses and position sizing. Consistency in trading comes from following a proven process rather than chasing every market move. Learn the psychology behind every candlestick, practice on historical charts, and let confirmation guide your entries instead of emotions.
Twitter: https://t.co/KGM0sHlFr2
#HammerPattern #HangingMan #CandlestickPatterns #CandlestickTrading #PriceAction #TechnicalAnalysis #StockMarket #Trading #Investing #SwingTrading #DayTrading #Intraday #Nifty #BankNifty #IndianStockMarket #MarketAnalysis #TradingStrategy #Bullish #Bearish #SupportResistance #ChartPatterns #RiskManagement #VolumeAnalysis #RSI #MACD #MovingAverage #TrendTrading #StockTrader #TradingEducation #LearnTrading #MarketPulse #Equity #OptionsTrading #FuturesTrading #ChartReading #SmartMoney #TradeSmart #Investor #Finance #WealthCreation #StockCharts #TradingTips #StockAnalysis #MarketLearning #FinancialFreedom #TraderLife #MarketPulse247 #IndianTraders
🚀𝗧𝗬𝗣𝗘𝗦 𝗢𝗙 𝗕𝗨𝗟𝗟𝗜𝗦𝗛 𝗖𝗔𝗡𝗗𝗟𝗘𝗦 𝗘𝗩𝗘𝗥𝗬 𝗧𝗥𝗔𝗗𝗘𝗥 𝗠𝗨𝗦𝗧 𝗞𝗡𝗢𝗪📈
🔥𝗗𝗼𝗻’𝘁 𝗝𝘂𝘀𝘁 𝗦𝗲𝗲 𝗚𝗿𝗲𝗲𝗻 𝗖𝗮𝗻𝗱𝗹𝗲𝘀 𝗟𝗲𝗮𝗿𝗻 𝗪𝗵𝗮𝘁 𝗧𝗵𝗲𝘆 𝗥𝗲𝗮𝗹𝗹𝘆 𝗠𝗲𝗮𝗻
Bullish candles are one of the most powerful tools in technical analysis because they reveal the strength of buyers in the market. A large bullish candle with almost no upper or lower wick usually shows aggressive buying and strong confidence from market participants. A bullish candle with a small lower wick indicates that sellers tried to push prices down but buyers quickly regained control. Standard bullish candles represent healthy demand and often appear during trending markets. Neutral bullish candles with long upper and lower shadows indicate a temporary balance between buyers and sellers, while candles with very small bodies and long upper shadows show weak buying momentum. Understanding these differences helps traders avoid poor entries and identify high probability opportunities. A single candle should never be traded in isolation because market context always matters.
Twitter (X): https://t.co/KGM0sHlFr2
📊𝗨𝘀𝗲 𝗖𝗮𝗻𝗱𝗹𝗲𝘀 𝗪𝗶𝘁𝗵 𝗖𝗼𝗻𝗳𝗶𝗿𝗺𝗮𝘁𝗶𝗼𝗻 𝗙𝗼𝗿 𝗕𝗲𝘁𝘁𝗲𝗿 𝗥𝗲𝘀𝘂𝗹𝘁𝘀
Professional traders combine bullish candles with support levels, trend direction, volume analysis and moving averages before taking any trade. A bullish candle formed near a strong support zone with rising volume usually has a higher probability of success than the same candle appearing in the middle of a sideways market. Always wait for confirmation from the next candle before entering a position and define your stop loss below the recent swing low to manage risk effectively. Consistent trading success comes from discipline, patience and following a well tested strategy rather than reacting emotionally to every green candle. Learning the language of candlesticks helps traders identify market strength, improve timing and build confidence in every trading decision.
Twitter (X): https://t.co/KGM0sHlFr2
✅𝗖𝗢𝗡𝗖𝗟𝗨𝗦𝗜𝗢𝗡
Bullish candles provide valuable insight into market sentiment, but they are most effective when used with trend analysis, support and resistance, volume and proper risk management. Focus on understanding the story behind every candle instead of memorizing patterns. The best traders wait for confirmation, protect their capital and let probabilities work in their favor. Master these bullish candle types and you will make smarter trading decisions with greater confidence over the long term.
Twitter (X): https://t.co/KGM0sHlFr2
#BullishCandles #CandlestickPattern #StockMarket #Trading #PriceAction #TechnicalAnalysis #SwingTrading #DayTrading #Investing #IndianStockMarket #Nifty #BankNifty #Sensex #StockTrader #TradingEducation #MarketAnalysis #TradingStrategy #SupportResistance #VolumeAnalysis #ChartPatterns #CandlestickAnalysis #MomentumTrading #BreakoutTrading #TrendFollowing #RiskManagement #TradingTips #StockAnalysis #LearnTrading #EquityMarket #Finance #WealthCreation #Investor #MarketPulse247 #Stocks #BullishTrend #TradingCommunity #ChartReading #FinancialFreedom #LongTermInvesting #IntradayTrading #StockEducation #MoneyManagement #MarketLearning #TradingLife #IndianTrader #StockCharts #InvestmentKnowledge #StockMarketIndia
🚨 𝗛𝗔𝗡𝗚𝗜𝗡𝗚 𝗠𝗔𝗡 𝗩𝗦 𝗦𝗛𝗢𝗢𝗧𝗜𝗡𝗚 𝗦𝗧𝗔𝗥 🚨
📊 𝗧𝗵𝗲 𝗕𝗲𝗮𝗿𝗶𝘀𝗵 𝗥𝗲𝘃𝗲𝗿𝘀𝗮𝗹 𝗣𝗮𝘁𝘁𝗲𝗿𝗻𝘀 𝗘𝘃𝗲𝗿𝘆 𝗧𝗿𝗮𝗱𝗲𝗿 𝗠𝘂𝘀𝘁 𝗞𝗻𝗼𝘄
🔥𝗛𝗲𝗮𝗱𝗶𝗻𝗴 𝟭: 𝗠𝗼𝘀𝘁 𝗧𝗿𝗮𝗱𝗲𝗿𝘀 𝗟𝗼𝘀𝗲 𝗠𝗼𝗻𝗲𝘆 𝗕𝗲𝗰𝗮𝘂𝘀𝗲 𝗧𝗵𝗲𝘆 𝗜𝗴𝗻𝗼𝗿𝗲 𝗧𝗵𝗲𝘀𝗲 𝗧𝘄𝗼 𝗖𝗮𝗻𝗱𝗹𝗲𝘀
The Hanging Man and Shooting Star are among the most reliable bearish reversal candlestick patterns used by professional traders to identify possible trend reversals. Although both patterns appear after a strong uptrend and indicate that buyers may be losing control, many beginners misunderstand the difference between them. The Hanging Man has a small real body near the top of the candle with a long lower shadow, showing that sellers managed to push prices sharply lower during the session before buyers recovered. This hidden selling pressure is an early warning sign that the uptrend may be weakening. The Shooting Star, on the other hand, has a small body near the bottom with a long upper shadow, showing that buyers initially pushed prices much higher but failed to maintain those gains as sellers entered aggressively. Both patterns reveal a battle between buyers and sellers where bullish momentum begins to fade. However, these candles should never be traded in isolation. Smart traders always wait for confirmation from the following candle, increasing trading volume, important resistance levels and supporting technical indicators before entering a short trade. Patience often separates profitable traders from emotional traders because one candle alone does not guarantee a market reversal.
💡𝗛𝗲𝗮𝗱𝗶𝗻𝗴 𝟮: 𝗧𝗵𝗲 𝗦𝗶𝗺𝗽𝗹𝗲 𝗦𝗲𝗰𝗿𝗲𝘁 𝗣𝗿𝗼𝗳𝗲𝘀𝘀𝗶𝗼𝗻𝗮𝗹 𝗧𝗿𝗮𝗱𝗲𝗿𝘀 𝗨𝘀𝗲 𝗕𝗲𝗳𝗼𝗿𝗲 𝗧𝗮𝗸𝗶𝗻𝗴 𝗔𝗻𝘆 𝗦𝗲𝗹𝗹 𝗧𝗿𝗮𝗱𝗲
Recognising these patterns is only the beginning of successful trading. The real edge comes from understanding market context and waiting for proper confirmation. A Hanging Man or Shooting Star forming near a major resistance zone, previous swing high, Fibonacci resistance or an overbought RSI has a much higher probability of success than one appearing randomly in the middle of a trend. Traders should also watch for a bearish confirmation candle closing below the Hanging Man or below the low of the Shooting Star before considering a short position. Strong selling volume further increases the reliability of the signal. Risk management is equally important because no candlestick pattern is accurate every time. Always place a logical stop loss above the candle high and never risk more than a small percentage of your trading capital on one trade. Combining candlestick analysis with price action, support and resistance, moving averages and volume creates a complete trading strategy instead of relying on a single candle. Remember that successful trading is not about predicting every market move. It is about managing risk, protecting capital and consistently following a disciplined trading plan. The traders who master these simple principles are the ones who survive and grow over the long term.
Twitter/X: https://t.co/KGM0sHl7Bu
📌 𝗖𝗢𝗡𝗖𝗟𝗨𝗦𝗜𝗢𝗡
The Hanging Man and Shooting Star are powerful bearish reversal patterns that can provide early warning signs of a possible trend reversal after an uptrend. Their true strength lies not in the candle itself but in confirmation through price action, volume and key technical levels. Avoid making emotional decisions based on a single candlestick. Instead, combine these patterns with proper risk management, disciplined trade execution and patience. Consistency in following a well tested strategy will always outperform random trading decisions. Learn the pattern, wait for confirmation, protect your capital and let probability work in your favour over time.
Twitter/X: https://t.co/KGM0sHl7Bu
#HangingMan #ShootingStar #CandlestickPatterns #PriceAction #StockMarket #Trading #TechnicalAnalysis #ShareMarket #SwingTrading #DayTrading #Intraday #Candlestick #StockTrading #TraderLife #Investing #Nifty #BankNifty #Sensex #IndianStockMarket #SupportAndResistance #MarketAnalysis #TradingEducation #StockMarketIndia #RiskManagement #TradingStrategy #BullMarket #BearMarket #VolumeAnalysis #ChartPatterns #LearnTrading #TradeSmart #TradingTips #MarketPulse247 #PriceActionTrading #TradingCommunity #StockCharts #MarketLearning #InvestWisely #FinancialEducation #TrendReversal #CandlestickAnalysis #EquityMarket #MomentumTrading #OptionTrading #LongTermSuccess #TradingPsychology #CapitalProtection #SmartTrading
🟨🟨 𝗛𝗔𝗡𝗚𝗜𝗡𝗚 𝗠𝗔𝗡 𝗖𝗔𝗡𝗗𝗟𝗘𝗦𝗧𝗜𝗖𝗞 𝗣𝗔𝗧𝗧𝗘𝗥𝗡 𝗖𝗢𝗠𝗣𝗟𝗘𝗧𝗘 𝗚𝗨𝗜𝗗𝗘 𝗙𝗢𝗥 𝗦𝗠𝗔𝗥𝗧 𝗧𝗥𝗔𝗗𝗘𝗥𝗦 🟨🟨
The Hanging Man is one of the most popular bearish reversal candlestick patterns in technical analysis. It usually appears after a strong uptrend and serves as an early warning that buying momentum may be weakening. While it does not guarantee a market reversal, it alerts traders to become cautious because sellers are beginning to challenge the buyers. Understanding the story behind this pattern helps traders protect profits and avoid buying near market tops.
𝗪𝗵𝗮𝘁 𝗜𝘀 𝘁𝗵𝗲 𝗛𝗮𝗻𝗴𝗶𝗻𝗴 𝗠𝗮𝗻 𝗣𝗮𝘁𝘁𝗲𝗿𝗻?
The Hanging Man is a single candlestick pattern with a small real body near the top of the candle and a long lower shadow that is at least twice the size of the body. It usually has little or no upper shadow. Although the candle may look similar to a Hammer, the difference lies in where it appears. A Hammer forms after a downtrend and is generally bullish, whereas a Hanging Man forms after an uptrend and warns of a possible bearish reversal.
𝗛𝗼𝘄 𝗜𝘀 𝘁𝗵𝗲 𝗛𝗮𝗻𝗴𝗶𝗻𝗴 𝗠𝗮𝗻 𝗙𝗼𝗿𝗺𝗲𝗱?
The formation of the Hanging Man reflects a change in market psychology. During the trading session, sellers push the price sharply lower, creating the long lower shadow. Buyers later recover most of the losses and manage to close the price near the opening level. Although buyers recover by the close, the important message is that sellers were finally strong enough to create significant downward pressure. This is often the first indication that the uptrend is losing strength.
𝗪𝗵𝘆 𝗦𝗵𝗼𝘂𝗹𝗱 𝗧𝗿𝗮𝗱𝗲𝗿𝘀 𝗨𝘀𝗲 𝘁𝗵𝗲 𝗛𝗮𝗻𝗴𝗶𝗻𝗴 𝗠𝗮𝗻?
The Hanging Man helps traders identify potential market tops before a major decline begins. It gives investors an opportunity to protect existing profits, tighten stop losses, or prepare for short-selling opportunities after confirmation. Instead of blindly chasing rising prices, traders can use this pattern to evaluate whether the bullish trend is running out of momentum.
Twitter id - https://t.co/KGM0sHlFr2
The pattern becomes much stronger when it appears near a resistance level, previous swing high, Fibonacci retracement level, psychological price zone, or after an overextended rally. Combining it with indicators like RSI, MACD, Volume, VWAP, or Moving Averages can significantly improve its reliability.
𝗣𝗿𝗼𝘀 𝗼𝗳 𝘁𝗵𝗲 𝗛𝗮𝗻𝗴𝗶𝗻𝗴 𝗠𝗮𝗻 𝗣𝗮𝘁𝘁𝗲𝗿𝗻
One of the biggest strengths of the Hanging Man is that it provides an early warning before a possible trend reversal. It is easy to identify, beginner-friendly, and works across stocks, indices, forex, commodities, and cryptocurrencies. The pattern also offers a logical stop-loss level above its high, making risk management simple. When confirmed by a bearish candle and supported by strong trading volume, its success rate improves considerably.
𝗖𝗼𝗻𝘀 𝗼𝗳 𝘁𝗵𝗲 𝗛𝗮𝗻𝗴𝗶𝗻𝗴 𝗠𝗮𝗻 𝗣𝗮𝘁𝘁𝗲𝗿𝗻
Like every technical pattern, the Hanging Man is not always accurate. Many traders make the mistake of selling immediately after spotting the candle without waiting for confirmation. This often results in false signals, especially during strong bullish trends. A Hanging Man appearing in a sideways market or with low trading volume has lower reliability. Major news events or earnings announcements can also invalidate the pattern quickly.
𝗛𝗼𝘄 𝘁𝗼 𝗧𝗿𝗮𝗱𝗲 𝘁𝗵𝗲 𝗛𝗮𝗻𝗴𝗶𝗻𝗴 𝗠𝗮𝗻
First, identify a well-established uptrend. Look for a Hanging Man with a small body near the top and a long lower shadow. Never enter a trade immediately after the pattern forms. Wait for the next candle to close below the Hanging Man's low. This bearish confirmation increases the probability of a successful trade. Place your stop loss above the Hanging Man's high and aim for nearby support levels or maintain a minimum risk-to-reward ratio of 1:2 or 1:3.
𝗧𝗵𝗲 𝗣𝘀𝘆𝗰𝗵𝗼𝗹𝗼𝗴𝘆 𝗕𝗲𝗵𝗶𝗻𝗱 𝘁𝗵𝗲 𝗛𝗮𝗻𝗴𝗶𝗻𝗴 𝗠𝗮𝗻
Every candlestick tells a story, and the Hanging Man is no different. It reveals that although buyers managed to recover before the close, sellers were finally able to push prices significantly lower during the session. This hidden weakness often signals that institutional investors may be booking profits while retail traders continue buying. Understanding this psychology helps traders stay ahead of potential market reversals instead of reacting after prices have already fallen.
https://t.co/KGM0sHlFr2
🟨🟨 𝗖𝗼𝗻𝗰𝗹𝘂𝘀𝗶𝗼𝗻 🟨🟨
The Hanging Man is not a signal to panic or sell immediately. Instead, think of it as an early warning sign that encourages careful observation. Always combine the pattern with confirmation candles, volume analysis, resistance levels, and proper risk management before making any trading decision. Traders who understand the psychology behind the Hanging Man and follow a disciplined trading plan are more likely to avoid emotional mistakes and improve their long-term consistency in the market.
X Hashtags
#HangingManPattern #CandlestickPattern #BearishReversal #PriceAction #TechnicalAnalysis #StockMarket #StockTrading #Trading #SwingTrading #IntradayTrading #DayTrading #ChartPatterns #TradingEducation #TradingStrategy #LearnTrading #RiskManagement #SupportAndResistance #VolumeAnalysis #Nifty50 #BankNifty #IndianStockMarket #StocksToWatch #MarketAnalysis #Investor #Finance #WealthCreation #TradingTips #StockMarketIndia #MarketPulse247 #TraderLife
🟨🟨 𝗛𝗔𝗠𝗠𝗘𝗥 𝗖𝗔𝗡𝗗𝗟𝗘𝗦𝗧𝗜𝗖𝗞 𝗣𝗔𝗧𝗧𝗘𝗥𝗡 𝗖𝗢𝗠𝗣𝗟𝗘𝗧𝗘 𝗚𝗨𝗜𝗗𝗘 𝗙𝗢𝗥 𝗕𝗘𝗚𝗜𝗡𝗡𝗘𝗥𝗦 𝗔𝗡𝗗 𝗣𝗥𝗢 𝗧𝗥𝗔𝗗𝗘𝗥𝗦 🟨🟨
The Hammer candlestick pattern is one of the most trusted bullish reversal patterns in technical analysis. It usually appears after a prolonged downtrend and indicates that selling pressure may be weakening while buyers are beginning to regain control. Although sellers initially push the price significantly lower during the trading session, buyers step in aggressively and drive the price back near the opening level before the candle closes. This creates the unique Hammer shape with a small real body at the top and a long lower shadow. The long wick represents rejection of lower prices and shows that buyers are willing to defend the stock at lower levels.
𝗪𝗵𝘆 𝗜𝘀 𝘁𝗵𝗲 𝗛𝗮𝗺𝗺𝗲𝗿 𝗣𝗮𝘁𝘁𝗲𝗿𝗻 𝗜𝗺𝗽𝗼𝗿𝘁𝗮𝗻𝘁?
A Hammer pattern becomes much more meaningful when it forms near a strong support level, previous swing low, Fibonacci retracement zone, moving average, or trendline. These areas often attract institutional buying, making the probability of a reversal much stronger. However, traders should never enter a trade immediately after spotting a Hammer. The safest approach is to wait for the next candle to close above the Hammer's high. This confirmation suggests that buyers have taken control and increases the chances of a successful trade.
𝗛𝗼𝘄 𝗜𝘀 𝘁𝗵𝗲 𝗛𝗮𝗺𝗺𝗲𝗿 𝗣𝗮𝘁𝘁𝗲𝗿𝗻 𝗙𝗼𝗿𝗺𝗲𝗱?
The formation of a Hammer reflects a battle between buyers and sellers. During the trading session, sellers dominate and push prices sharply lower. However, buyers enter the market at lower levels and absorb the selling pressure. As buying momentum increases, the price recovers and closes close to the opening price. This price action creates a long lower shadow and a small body, clearly showing that sellers lost strength while buyers gained confidence.
𝗪𝗵𝘆 𝗦𝗵𝗼𝘂𝗹𝗱 𝗧𝗿𝗮𝗱𝗲𝗿𝘀 𝗨𝘀𝗲 𝘁𝗵𝗲 𝗛𝗮𝗺𝗺𝗲𝗿 𝗣𝗮𝘁𝘁𝗲𝗿𝗻?
One of the biggest advantages of the Hammer pattern is its simplicity. It is easy to identify on charts and can be used in stocks, indices, commodities, forex, and cryptocurrencies. The pattern also provides a clear stop-loss level below the Hammer's low, allowing traders to maintain disciplined risk management. When combined with RSI, MACD, Volume, VWAP, or moving averages, the Hammer becomes an even more powerful trading signal.
𝗣𝗿𝗼𝘀 𝗼𝗳 𝘁𝗵𝗲 𝗛𝗮𝗺𝗺𝗲𝗿 𝗣𝗮𝘁𝘁𝗲𝗿𝗻
The Hammer offers an early indication that bearish momentum is weakening. It provides clearly defined entry and exit points, making trade planning easier. The pattern is beginner-friendly, works across multiple timeframes, and becomes highly reliable when supported by volume, trend analysis, and key support zones. It also helps traders maintain an attractive risk-to-reward ratio because the stop loss remains relatively small.
𝗖𝗼𝗻𝘀 𝗼𝗳 𝘁𝗵𝗲 𝗛𝗮𝗺𝗺𝗲𝗿 𝗣𝗮𝘁𝘁𝗲𝗿𝗻
Like every technical pattern, the Hammer is not perfect. It can generate false signals when it appears in sideways markets or without a prior downtrend. Low trading volume reduces its reliability, and sudden news events or earnings announcements can completely invalidate the pattern. Trading solely based on the Hammer without confirmation often leads to unnecessary losses.
𝗛𝗼𝘄 𝘁𝗼 𝗧𝗿𝗮𝗱𝗲 𝘁𝗵𝗲 𝗛𝗮𝗺𝗺𝗲𝗿 𝗣𝗮𝘁𝘁𝗲𝗿𝗻
Start by identifying a clear downtrend. Look for a candle with a small real body near the top and a lower shadow at least twice the size of the body. Wait for the next candle to close above the Hammer's high before entering a buy trade. Place the stop loss below the Hammer's low and aim for the next resistance level or maintain a minimum risk-to-reward ratio of 1:2 or 1:3. Following these rules improves consistency and protects trading capital.
𝗧𝗵𝗲 𝗣𝘀𝘆𝗰𝗵𝗼𝗹𝗼𝗴𝘆 𝗕𝗲𝗵𝗶𝗻𝗱 𝘁𝗵𝗲 𝗛𝗮𝗺𝗺𝗲𝗿
The Hammer is more than just a candlestick pattern. It tells the story of market sentiment. Sellers initially dominate and create panic, but buyers absorb the selling pressure and regain control before the session ends. This shift in psychology often marks the beginning of a trend reversal. Understanding this story helps traders make informed decisions instead of relying only on candle shapes.
🟨🟨 𝗖𝗼𝗻𝗰𝗹𝘂𝘀𝗶𝗼𝗻 🟨🟨
The Hammer candlestick pattern is one of the most valuable reversal signals for traders, but it should always be used as part of a complete trading strategy. Combine it with trend analysis, support and resistance, volume confirmation, and proper risk management before taking any position. Patience and discipline are far more important than predicting every market move. When used correctly, the Hammer pattern can help traders identify high-probability buying opportunities while protecting capital and improving long-term trading consistency.
X Hashtags
#HammerPattern #CandlestickPattern #CandlestickTrading #PriceAction #TechnicalAnalysis #StockMarket #StockTrading #Trading #SwingTrading #IntradayTrading #DayTrading #ChartPatterns #TradingEducation #TradingStrategy #LearnTrading #RiskManagement #SupportAndResistance #VolumeAnalysis #Nifty50 #BankNifty #IndianStockMarket #StocksToWatch #MarketAnalysis #Investor #Finance #WealthCreation #TradingTips #StockMarketIndia #MarketPulse247 #TraderLife
📊 Types of Doji-Like Candlestick Patterns: A Complete Guide for Smart Traders
Doji-like candlestick patterns are among the most powerful tools in technical analysis because they reflect market indecision and often signal a potential trend reversal. A Doji forms when the opening and closing prices are nearly the same, indicating a balance between buyers and sellers. However, these patterns should always be confirmed with the next candle before taking any trading decision.
🔹 1. Abandoned Baby Top
A rare bearish reversal pattern that appears after a strong uptrend. It consists of a bullish candle, a Doji with a price gap, and a bearish candle. It suggests that buyers are losing control and sellers are taking over.
🔹 2. Shooting Star
This bearish reversal pattern forms near the top of an uptrend. It has a small body with a long upper shadow, showing that buyers pushed prices higher but sellers forced them back down.
🔹 3. Hanging Man
The Hanging Man appears after an uptrend and has a long lower shadow with a small body. It indicates that selling pressure is increasing and a bearish reversal may occur if confirmed by the next candle.
🔹 4. Long-Legged Doji
This pattern has long upper and lower shadows, representing intense volatility and uncertainty. It often signals that the current trend is weakening and a major move could be approaching.
🔹 5. Morning Doji Star
A bullish three-candle reversal pattern that forms after a downtrend. It indicates that selling pressure is fading and buyers are gaining strength, often leading to an upward reversal.
🔹 6. Evening Doji Star
The opposite of the Morning Doji Star, this bearish reversal pattern appears after an uptrend and signals that buyers are losing momentum while sellers are taking control.
🔹 7. Hammer
The Hammer forms after a downtrend and has a long lower shadow with a small body. It shows strong buying interest from lower levels and often signals the beginning of a bullish reversal.
━━━━━━━━━━━━━━━━━━
📢 𝐂𝐎𝐍𝐂𝐋𝐔𝐒𝐈𝐎𝐍
✅ Doji-like candlestick patterns are powerful reversal signals, but they should never be traded in isolation. Always wait for confirmation from the next candle and analyze the prevailing trend, trading volume, and key support or resistance levels before taking any trade. Combining these patterns with proper risk management and technical indicators can significantly improve trading accuracy and decision-making. 📈📊
𝐃𝐨𝐣𝐢 𝐂𝐚𝐧𝐝𝐥𝐞𝐬𝐭𝐢𝐜𝐤 𝐏𝐚𝐭𝐭𝐞𝐫𝐧: 𝐀 𝐏𝐨𝐰𝐞𝐫𝐟𝐮𝐥 𝐒𝐢𝐠𝐧𝐚𝐥 𝐨𝐟 𝐌𝐚𝐫𝐤𝐞𝐭 𝐈𝐧𝐝𝐞𝐜𝐢𝐬𝐢𝐨𝐧
The Doji candlestick is one of the most important price action patterns every trader should understand. It forms when the opening and closing prices of a candle are nearly the same, indicating a balance between buyers and sellers. This temporary equilibrium often signals that the current trend may be losing momentum and a significant move could be approaching. However, a Doji alone is not a buy or sell signal. It should always be analyzed with the overall market trend, support and resistance levels, volume, and confirmation from the next candle.
There are four common types of Doji patterns. The Standard Doji reflects pure market indecision. The Long-Legged Doji represents high volatility with neither buyers nor sellers gaining control. The Dragonfly Doji, when formed after a downtrend, can indicate a potential bullish reversal. The Gravestone Doji, appearing after an uptrend, may signal a possible bearish reversal. Successful traders wait for confirmation before entering a trade and always manage risk with a proper stop loss.
Learning to identify Doji patterns can improve trade timing and help traders avoid emotional decisions. When combined with sound risk management and disciplined execution, the Doji becomes a valuable tool for spotting high-probability trading opportunities in both bullish and bearish markets.
𝐂𝐨𝐧𝐜𝐥𝐮𝐬𝐢𝐨𝐧
The Doji pattern reminds traders that patience is often more profitable than prediction. Wait for confirmation, trade with the trend, protect your capital, and let price action guide your decisions. Consistency comes from discipline, not from guessing market direction.
#DojiPattern #CandlestickPattern #PriceAction #StockMarket #Trading #TechnicalAnalysis #CandlestickTrading #SwingTrading #IntradayTrading #DayTrading #StockMarketIndia #Nifty50 #BankNifty #ChartPatterns #TradingEducation #RiskManagement #SupportAndResistance #MarketAnalysis #Investing #TraderLife #TradingStrategy #LearnTrading #StockTrading #MarketPulse247 #TradingTips
𝐒𝐡𝐨𝐨𝐭𝐢𝐧𝐠 𝐒𝐭𝐚𝐫 𝐏𝐚𝐭𝐭𝐞𝐫𝐧: 𝐀 𝐏𝐨𝐰𝐞𝐫𝐟𝐮𝐥 𝐁𝐞𝐚𝐫𝐢𝐬𝐡 𝐑𝐞𝐯𝐞𝐫𝐬𝐚𝐥 𝐒𝐢𝐠𝐧𝐚𝐥 𝐄𝐯𝐞𝐫𝐲 𝐓𝐫𝐚𝐝𝐞𝐫 𝐒𝐡𝐨𝐮𝐥𝐝 𝐊𝐧𝐨𝐰
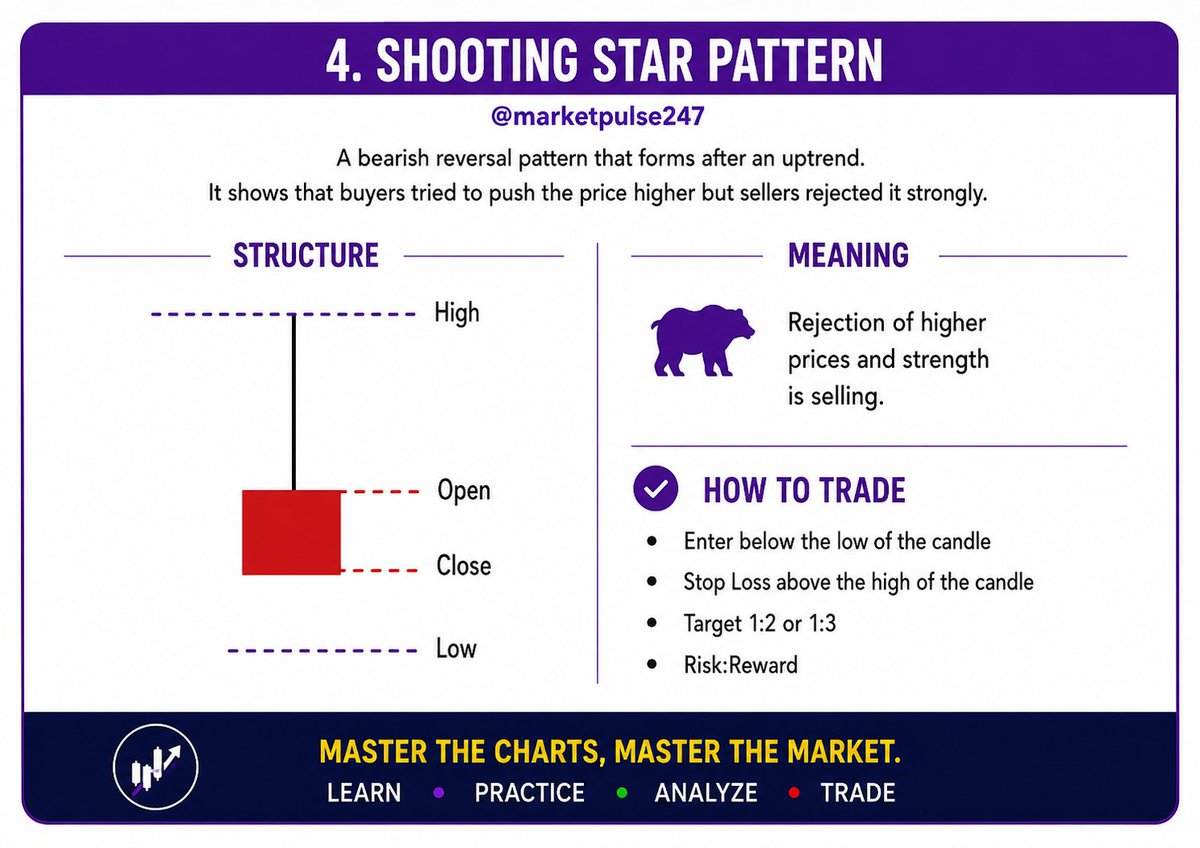
The Shooting Star Pattern is one of the most reliable bearish candlestick patterns used by traders to identify a possible trend reversal after a strong uptrend. It forms when buyers push the price significantly higher during the trading session, but sellers regain complete control before the candle closes. This creates a candle with a small real body near the bottom and a long upper shadow, showing strong rejection of higher prices.
This pattern reflects a shift in market sentiment. Although buyers initially dominate, sellers overpower them and force the price back down, indicating that bullish momentum is weakening. However, traders should never rely on this pattern alone. Wait for confirmation through the next bearish candle, increased trading volume, or resistance levels before entering a trade.
A common trading approach is to enter a short position once the price breaks below the low of the Shooting Star candle. Place the stop loss above the candle's high to manage risk effectively. Maintaining a minimum 1:2 or 1:3 Risk-Reward Ratio helps traders remain profitable over the long term, even if not every trade succeeds. Combining this pattern with trend analysis, moving averages, RSI, or volume confirmation can significantly improve the probability of successful trades.
𝐂𝐨𝐧𝐜𝐥𝐮𝐬𝐢𝐨𝐧
The Shooting Star Pattern is a valuable tool for identifying potential bearish reversals, but success comes from combining it with proper confirmation, disciplined risk management, and patience. Master the pattern, follow your trading plan, and let consistency build long-term profitability.
#ShootingStar #CandlestickPattern #PriceAction #StockMarket #Trading #TechnicalAnalysis #SwingTrading #DayTrading #ChartPatterns #BearishReversal #RiskManagement #TradingStrategy #StockTrader #Investing #MarketAnalysis #CandlestickTrading #LearnTrading #StockEducation #TraderLife #TradingTips #IndianStockMarket #Nifty50 #BankNifty #MarketPulse247 #StockMarketLearning
𝐇𝐚𝐦𝐦𝐞𝐫 𝐏𝐚𝐭𝐭𝐞𝐫𝐧: 𝐀 𝐒𝐭𝐫𝐨𝐧𝐠 𝐁𝐮𝐥𝐥𝐢𝐬𝐡 𝐑𝐞𝐯𝐞𝐫𝐬𝐚𝐥 𝐒𝐢𝐠𝐧𝐚𝐥 𝐄𝐯𝐞𝐫𝐲 𝐓𝐫𝐚𝐝𝐞𝐫 𝐒𝐡𝐨𝐮𝐥𝐝 𝐊𝐧𝐨𝐰
The Hammer Pattern is one of the most popular bullish candlestick patterns used in technical analysis to identify a potential trend reversal after a downtrend. It is characterized by a small real body near the top of the candle and a long lower shadow, showing that sellers pushed prices significantly lower during the session but buyers stepped in aggressively and drove the price back near the day's high.
This pattern reflects a shift in market sentiment from bearish to bullish. It indicates that selling pressure is weakening and buyers are beginning to gain control. However, traders should avoid entering a trade solely based on the appearance of a Hammer candle. Confirmation through the next bullish candle, higher trading volume, support levels, or indicators like RSI, MACD, or moving averages can significantly improve the probability of a successful trade.
A common trading strategy is to enter a buy trade above the high of the Hammer candle after confirmation. The stop-loss is usually placed below the low of the Hammer to limit downside risk. Maintaining a minimum risk-reward ratio of 1:2 or 1:3 helps traders stay disciplined and profitable over the long term while protecting trading capital from unnecessary losses.
https://t.co/KGM0sHlFr2
𝐂𝐨𝐧𝐜𝐥𝐮𝐬𝐢𝐨𝐧
The Hammer Pattern is a powerful bullish reversal signal that helps traders identify potential buying opportunities after a decline. When combined with proper confirmation, sound risk management, and disciplined execution, it can become an effective tool for improving trading accuracy and achieving consistent long-term success in the stock market.
https://t.co/KGM0sHlFr2
#HammerPattern #BullishReversal #CandlestickPattern #StockMarket #Trading #TechnicalAnalysis #PriceAction #SwingTrading #DayTrading #StockTrading #Nifty #BankNifty #IndianStockMarket #TraderLife #TradingEducation #RiskManagement #TradingStrategy #Investing #MarketAnalysis #LearnTrading #ChartPatterns #Finance #WealthCreation #MarketPulse247 #TradingTips
𝐁𝐞𝐚𝐫𝐢𝐬𝐡 𝐄𝐧𝐠𝐮𝐥𝐟𝐢𝐧𝐠 𝐏𝐚𝐭𝐭𝐞𝐫𝐧: 𝐀 𝐏𝐨𝐰𝐞𝐫𝐟𝐮𝐥 𝐒𝐢𝐠𝐧𝐚𝐥 𝐨𝐟 𝐓𝐫𝐞𝐧𝐝 𝐑𝐞𝐯𝐞𝐫𝐬𝐚𝐥
The Bearish Engulfing Pattern is one of the most reliable candlestick patterns used by traders to identify a potential reversal after an uptrend. It consists of two candles. The first candle is bullish (green), showing buyers are still in control. The second candle is bearish (red) and completely engulfs the body of the previous green candle, indicating that sellers have taken control of the market.
This pattern becomes more powerful when it appears near a major resistance level or after a strong price rally. It reflects a sudden shift in market sentiment, where buying pressure is overwhelmed by aggressive selling. However, traders should avoid taking trades based solely on this pattern. It is always better to confirm the signal with increased trading volume, resistance zones, trendlines, or technical indicators such as RSI or MACD.
A common trading strategy is to enter a short trade below the low of the bearish engulfing candle. The stop-loss is generally placed above the high of the engulfing candle to manage risk effectively. Maintaining a minimum 1:2 or 1:3 risk-reward ratio helps improve long-term trading consistency and protects capital during losing trades.
𝑪𝒐𝒏𝒄𝒍𝒖𝒔𝒊𝒐𝒏
The Bearish Engulfing Pattern is a valuable reversal signal that can help traders identify high-probability selling opportunities. When combined with proper confirmation, disciplined risk management, and patience, it becomes an effective tool for improving trading decisions and long-term profitability.
#BearishEngulfing #CandlestickPattern #StockMarket #Trading #PriceAction #TechnicalAnalysis #SwingTrading #DayTrading #StockTrading #Nifty #BankNifty #IndianStockMarket #TraderLife #TradingEducation #RiskManagement #TradingStrategy #Investing #MarketAnalysis #ChartPatterns #LearnTrading #StockMarketIndia #Finance #WealthCreation #MarketPulse247 #TradingTips
𝐁𝐮𝐥𝐥𝐢𝐬𝐡 𝐄𝐧𝐠𝐮𝐥𝐟𝐢𝐧𝐠 𝐏𝐚𝐭𝐭𝐞𝐫𝐧: 𝐀 𝐏𝐨𝐰𝐞𝐫𝐟𝐮𝐥 𝐑𝐞𝐯𝐞𝐫𝐬𝐚𝐥 𝐒𝐢𝐠𝐧𝐚𝐥 𝐄𝐯𝐞𝐫𝐲 𝐓𝐫𝐚𝐝𝐞𝐫 𝐒𝐡𝐨𝐮𝐥𝐝 𝐊𝐧𝐨𝐰
The Bullish Engulfing Pattern is one of the most reliable candlestick patterns used by traders to identify a potential trend reversal. It usually appears after a prolonged downtrend, indicating that buyers are stepping in and taking control of the market.
The pattern consists of two candles. The first candle is bearish (red), showing that sellers are still dominating. The second candle is bullish (green) and completely engulfs the body of the previous red candle. This strong buying pressure suggests that market sentiment has shifted from bearish to bullish.
However, traders should avoid entering a trade immediately after spotting the pattern. It is always better to wait for confirmation. A buy entry is generally taken when the price moves above the high of the second bullish candle. The stop-loss should be placed below the low of the first candle to manage risk effectively.
For better accuracy, combine this pattern with support zones, moving averages, RSI, or higher trading volume. These additional confirmations can significantly improve the probability of a successful trade. Traders should also maintain a minimum risk-to-reward ratio of 1:2 or 1:3 to ensure long-term profitability.
https://t.co/KGM0sHlFr2
𝐂𝐨𝐧𝐜𝐥𝐮𝐬𝐢𝐨𝐧
The Bullish Engulfing Pattern is a simple yet highly effective price action signal that helps traders identify potential buying opportunities after a downtrend. When combined with proper confirmation, disciplined risk management, and patience, it can become a valuable part of any trading strategy. Remember, successful trading is not about winning every trade—it is about following a proven process consistently and protecting your capital.