Transformers are easier to learn when you can poke the model directly.
Transformer Explainer is an interactive visualization tool for learning how Transformer-based text-generation models like GPT work.
It helps you connect the architecture to real behavior by running a live GPT-2 model in the browser, letting you enter your own text, and showing how internal components work together to predict the next tokens.
Key features:
• Live GPT-2 in the browser – experiment without setting up a separate model server first
• Custom text input – try your own prompts and watch how the model handles them
• Internal component views – observe the operations that work together inside the Transformer
• Next-token prediction focus – connect each visual step to the model’s token predictions
• Local development path – clone the repo, install dependencies, and run it with npm for deeper inspection
It’s open-source (MIT license).
Link in the reply 👇
Un rey cría una pulga hasta que se vuelve gigante…
y organiza un concurso para casar a su hija con quien adivine la piel.
El que acierta no es un príncipe… sino un leñador del bosque 😱
Despues de 24 años a toda una generación se le hizo canon de golpe esta escena final de Supercampeones. Se viene Japon vs Brasil en 16vos del Mundial 2026 y tendremos el desenlace que el anime no nos dió 🥲
The entire core of a neural network on four cards.
Neuron, forward pass, activations, backprop. Learn these four and you understand how every model from a perceptron to a transformer predicts and learns.
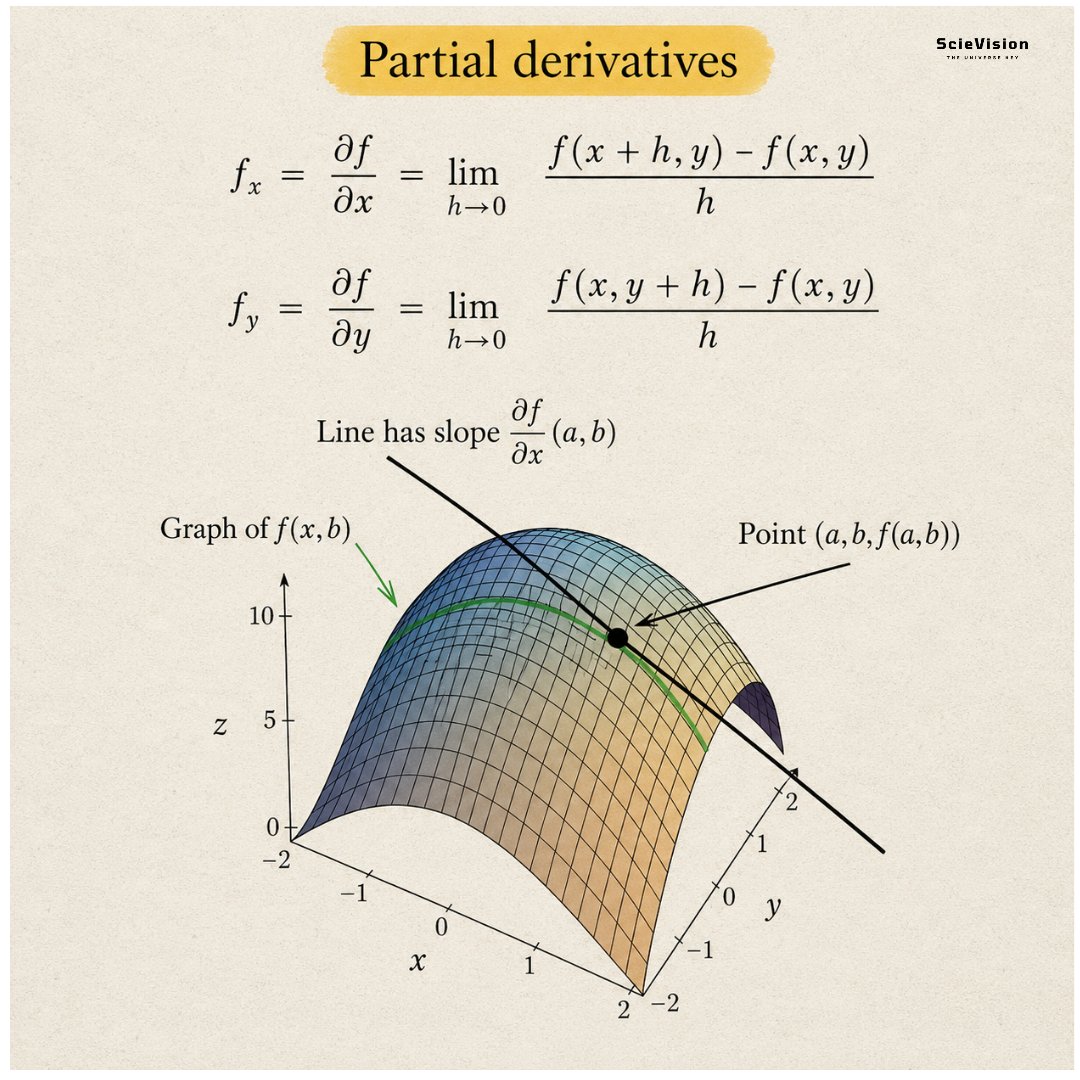
Partial Derivatives ✍️
Imagine standing on a hillside and trying to answer the question, "How steep is this hill right here?" The steepness depends on which direction you decide to walk. The hill might be very steep heading north but almost flat heading east. There's no single answer that works for all directions. This is the problem partial derivatives solve. In mathematics, many functions depend on more than one variable at the same time, and their graphs are not simple curves but entire three-dimensional surfaces, like the smooth rounded hill shape shown in the diagram. The height of the surface at any point depends on both an x-direction and a y-direction at the same time.
The clever solution is simple once you see it. If you want to measure how the surface changes in the x-direction, you pretend y doesn't exist by fixing it at one value and keeping it constant. The diagram illustrates this well with the green curve traced across the surface. This curve shows what you would get if you took a sharp knife, aligned it parallel to the x-direction at a specific y-value, and sliced through the surface, turning the complex three-dimensional problem into a simple familiar curve. Then, you choose your point of interest, marked as the black dot on the surface, and ask how steeply that green curve rises or falls at that point. This gives you the straight black tangent line touching the curve precisely at that spot. The slope of that tangent line is the partial derivative; it tells you how fast the surface climbs or falls in the x-direction at that specific point, with y held constant. Then, you repeat the process with x fixed and y free to find the slope in the other direction. Together, these two slopes help describe the full shape of the surface around your point of interest.
What makes this so powerful is that it works for any number of variables and appears everywhere in the real world. A weather temperature map has one partial derivative that shows how quickly temperature changes as you drive north, and another that shows how quickly it changes as you drive east. Together, they create a picture of the full temperature landscape around you. Almost every equation governing how the physical world behaves like how heat spreads through metal, how water flows around a ship, how an aircraft wing generates lift, and how a neural network learns from data is written in terms of partial derivatives. This makes them one of the most important and widely used tools in mathematics and science. But the main idea behind all this complexity is simply standing on a hillside, choosing one direction, fixing everything else completely still, and asking how steep it is right here.
Why Borders Define the Interior?
Ever wonder how mathematicians link the boundary of a region to the behavior of the field inside it? 🌀 Stokes' Theorem is the bridge. It shows that the macroscopic circulation along a closed curve is exactly equal to the sum of all microscopic circulations (curl) across the enclosed surface. This isn't just abstract math—it's the core of Faraday’s Law of Induction, explaining how a changing magnetic flux induces an electric current in a wire loop. ⚡
#stokestheorem #calculus #physics #math #Faraday
markov chains are simple but powerful.
they model systems where the next state depends on the current state.
not the whole past.
• states → possible conditions
• transitions → ways the system moves
• probabilities → uncertainty with structure
• memorylessness → only now matters
• steady state → long term behavior emerges
weather.
markets.
language.
biology.
robot navigation.
queues.
markov chains teach you a brutal systems lesson:
complex behavior can emerge from simple transition rules.
🚨🚨🚨 "Si tengo cáncer, no iré al hospital. He visto morir a demasiadas personas por la quimioterapia, no por el cáncer"...
"Ayunaré durante 30 días y dejaré de trabajar"...
Dr. Pascal Trotta. Radiólogo con 20 años de experiencia.
Watching the manufacturing process of one of the most powerful angle grinders gave me a whole new level of appreciation for engineering and industrial craft.
Deriving the quadratic formula by completing the square, shown step by step.
- Start with ax² + bx + c = 0.
- Divide by a
- Move the constant to the right
- Add (b/2a)² to both sides
- Simplify the right side to (b² - 4ac)/4a²
- Take square roots
- Solve to reach x = (-b ± √(b² - 4ac)) / (2a)
It is used to calculate the path of a projectile like a thrown ball or to find break-even points in business where costs and revenue follow a parabolic curve.