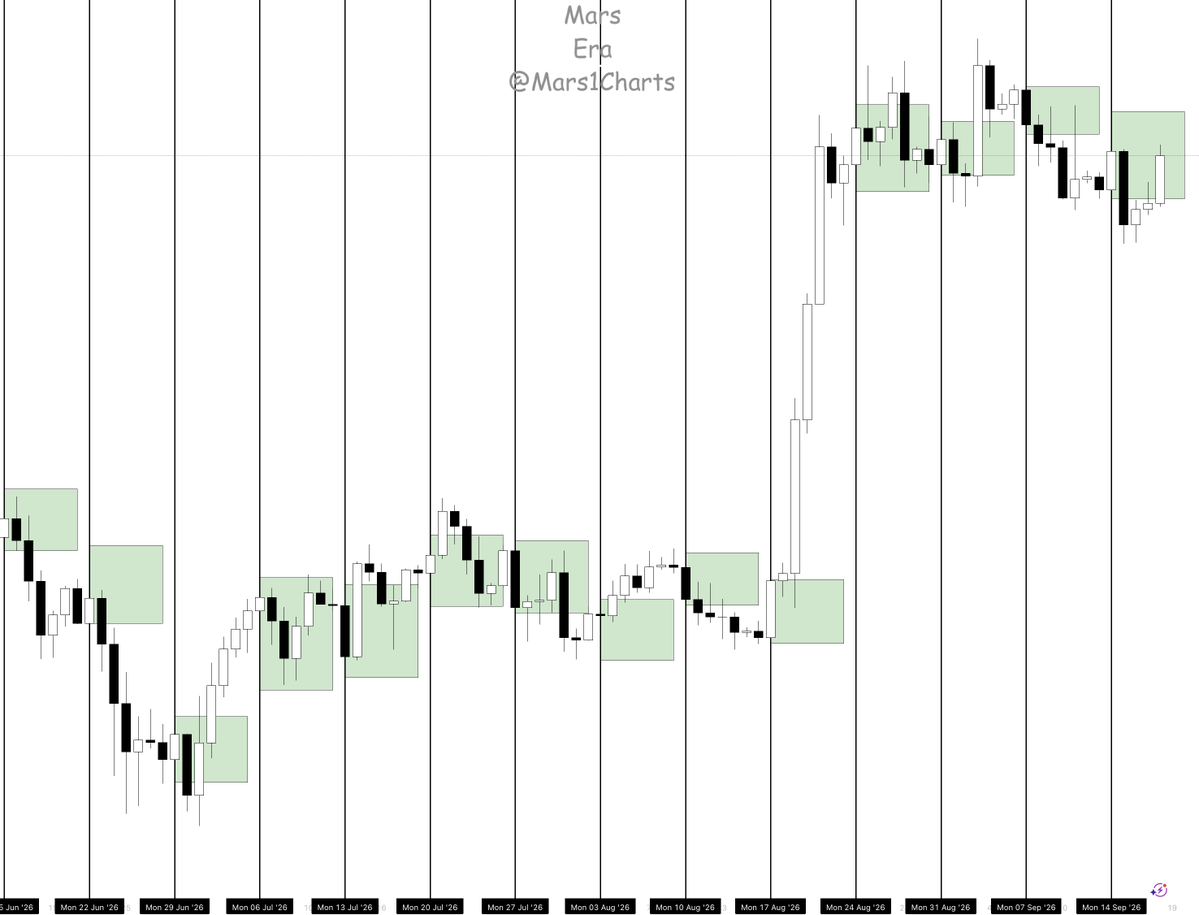
Can Monday’s range help identify $BTC is weekly move?
Bracket Monday’s high and low, then watch how price behaves around those boundaries throughout the rest of the week.
A break above Monday’s high creates a potential upside continuation setup. A break below Monday’s low creates a potential downside continuation setup.
The question is whether price can hold outside the range and extend, or whether the breakout fails and price returns inside.
There are three main scenarios to study:
• Break and hold: price breaks a boundary, holds it on a retest and continues in that direction.
• Failed breakout: price moves outside, then returns inside. The midpoint and opposite boundary become levels to watch, rather than guaranteed targets.
• Continued ranging: price stays inside Monday’s bracket until a clearer move develops.
62% of weeks broke only one Monday boundary, while 36% broke both. Just 2% stayed entirely inside.
That gives us a reason to investigate Monday’s range as a framework for weekly direction. It does not tell us to buy or sell every breakout.
The potential is a repeatable way to define direction, invalidation and expansion targets using one clearly defined range.
Failure: Losing $80,800 would weaken the immediate consolidation. Losing $80,400 would expose the former supply zone to a retest. That would be a pullback warning not automatically a complete bearish reversal.
$SOL Daily | 19 September 2026
SOL is consolidating near $112 after clearing Monday’s high around $104–$105 and the previous local highs near $110.
Holding $110 supports another test of $114. A confirmed break above opens $118–$120.
Losing $110 would increase the chance of a deeper pullback toward $104–$105.
Bias: Bullish, but extended from the breakout base.
One red candle after a strong rally doesn’t confirm a reversal.
$ETH Daily | 19 September 2026
ETH is trading near $2,645, attempting to establish support above Monday’s high around $2,620–$2,640.
Holding that area and clearing $2,660–$2,690 would strengthen continuation toward $2,790.
A daily close back below the breakout area would weaken the setup. Deeper support sits around $2,500–$2,460.
Bias: Bullish breakout attempt. Today’s candle still needs to close.
$BTC Intraday | 19 September 2026
15m: Consolidating around $81,220 after the sharp rally.
Continuation watch: Hold $81,000–$81,050 and form a higher low, or clear $81,400–$81,500 and hold the retest.
Upside: $81,650–$82,400.
Losing $81,000 and failing to reclaim it would put $80,850, then $80,400 in focus.
Spot buying supported the breakout but has cooled during consolidation.
Bullish context. Patience with entry.
$BTC Daily & 4H | 19 September 2026
BTC is consolidating near $81,260 after breaking above the descending channel, September open and former supply zone.
Bias: Bullish while the breakout holds.
Resistance: $81,450–$81,650. Acceptance above opens $82,300–$82,400.
Support: $80,800–$81,000, then $80,400. Losing $80,400 would expose $79,350–$80,050 to a retest.
Strong breakout. Now buyers need to defend the reclaimed levels.
Can Monday’s range help identify $BTC is weekly move?
Bracket Monday’s high and low, then watch how price behaves around those boundaries throughout the rest of the week.
A break above Monday’s high creates a potential upside continuation setup. A break below Monday’s low creates a potential downside continuation setup.
The question is whether price can hold outside the range and extend, or whether the breakout fails and price returns inside.
There are three main scenarios to study:
• Break and hold: price breaks a boundary, holds it on a retest and continues in that direction.
• Failed breakout: price moves outside, then returns inside. The midpoint and opposite boundary become levels to watch, rather than guaranteed targets.
• Continued ranging: price stays inside Monday’s bracket until a clearer move develops.
62% of weeks broke only one Monday boundary, while 36% broke both. Just 2% stayed entirely inside.
That gives us a reason to investigate Monday’s range as a framework for weekly direction. It does not tell us to buy or sell every breakout.
The potential is a repeatable way to define direction, invalidation and expansion targets using one clearly defined range.
Price is everything. Trade the chart and ignore the hype about whether “we’re back” or not.
We’re still inside the range.
the range breakout is only confirmed once $BTC breaks and holds above $83K. Until then, it’s still range bound price action.
BREAKING: 🇺🇸 The CFTC has sent its crypto rules to the White House for review.
Congress failed, but the SEC and CFTC are still delivering pro-crypto regulation.
$XAU / $GOLD Daily | 18 September 2026
Gold is attempting to reclaim $4,377, trading near $4,387 in this morning’s snapshot.
A daily close above resistance, followed by a successful retest of $4,360–$4,377, would strengthen the recovery.
Upside references: $4,440 - $4,520.
Losing $4,360–$4,344 would weaken the reclaim and reopen $4,275–$4,250. Deeper support sits near $4,204.
Bias: Improving, but today’s candle is unfinished.
UTC volatility watch:
13:15 — US industrial production
13:30 — Fed Bowman speech
$BTC Intraday | 18 September 2026
15m: Strong advance through yesterday’s high near $77,130, reaching ~$78,420 before pulling back.
Spot buying is participating, while falling open interest suggests position unwinding is also contributing.
Continuation watch: A higher low around $77,800–$78,000, followed by renewed buying.
Upside: $78,420 - $78,548.
Rejection at resistance followed by a structure break could bring $77,500–$77,300 into focus.
Bullish direction doesn’t justify chasing an extended entry.
UTC volatility watch:
13:15 — US industrial production
13:30 — Fed Bowman speech
$BTC Daily & 4H | 18 September 2026
BTC has reclaimed $76,800-$77,200 and recovered toward $78,140 in this morning
Daily: Testing the descending channel’s upper boundary, with the September open at $78,548 directly overhead.
4H: Recovery structure has improved. Holding above $78,548 would open $79,350–$79,600, then the $80,000 area.
Support: $77,200-$77,300, followed by $76,800.
Bias: Bullish recovery into resistance. The daily breakout still needs confirmation.
Rejection at the monthly open followed by loss of $77,200 would weaken the rally and put $76,800 back in focus.
@KillaXBT People can’t read cause they see that you are against their bias or direction they’re likely too late or too early or in a big loss or just got liquidated
and other then that they’re lazy to study and learn the chart !