5 for 5 in FinAstro Spaces this year!!!!!
12-Feb: bearish, down in March 🎯
12-March: low approaching but no hurry to buy 🎯
21-April: bullish! 🎯
12-May: momentum top in (QQQ RSI high 11-May) 🎯
11-June: range bound, SPX YR1 7582 key level 🎯
(None in Jan)
With @AstroCryptoGuru@margo_amala and @TimeTrades1
So the "big question," is the low in?
Probably this is what everyone wants to hear. But I think the more important questions are:
What is your strategy?
What is your time frame?
What is your vehicle?
I didn't need to have an answer to the low question to see all my short-term charts lighting up green before the open. But this is my strategy & time frame, and I have my preferred vehicles.
@AstroCryptoGuru You are very good at this strategy!
I like to see the all clear from VIX VXX SVXY and buy strength! What holds up best out of corrections can be (not always though) the next big winner!
So the "big question," is the low in?
Probably this is what everyone wants to hear. But I think the more important questions are:
What is your strategy?
What is your time frame?
What is your vehicle?
I didn't need to have an answer to the low question to see all my short-term charts lighting up green before the open. But this is my strategy & time frame, and I have my preferred vehicles.
From a forecasting point of view, one of the big challenges that I've mentioned a few times is that one day DJT says one thing, and the opposite the next. Impossible to predict - kudos to everyone who tries!
This is why I like to rely on technical setups for trades and Astro confidence for sizing.
5 for 5 in FinAstro Spaces this year!!!!!
12-Feb: bearish, down in March 🎯
12-March: low approaching but no hurry to buy 🎯
21-April: bullish! 🎯
12-May: momentum top in (QQQ RSI high 11-May) 🎯
11-June: range bound, SPX YR1 7582 key level 🎯
(None in Jan)
With @AstroCryptoGuru@margo_amala and @TimeTrades1
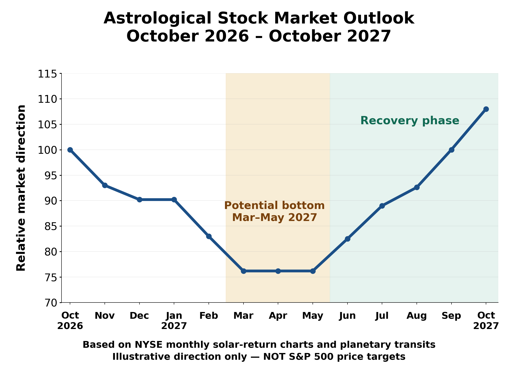
A couple of weeks ago, I put my astrological perspective on the US stock market for the period October 2026-October 2027 on my website. Here are the details.
My analysis of the New York Stock Exchange (NYSE) monthly solar-return charts suggests a difficult period for the stock market from late 2026 through spring 2027, followed by a strong recovery in the second half of the year. The accompanying chart illustrates the expected market direction rather than actual S&P 500 index levels.
Planetary transits reinforce this cautious outlook. Mars is currently approaching Ketu, a conjunction associated with disruption. Mars turns retrograde in February 2027 and forms a square aspect with Uranus, suggesting sudden market reversals and heightened volatility. Mercury also enters its sign of debilitation, Pisces, during February, adding another potentially unfavorable influence.
In April 2027, retrograde Mars approaches within one degree of Ketu before turning direct. This configuration may coincide with an important market turning point. Interestingly, the NYSE monthly solar-return charts independently suggest that the market could establish a bottom around March–May 2027.
Taken together, these astrological indications suggest continued market weakness during the first several months of 2027, followed by improving conditions beginning around May or June. The second half of 2027 appears considerably more favorable, with the possibility of a sustained advance through December.
This forecast therefore differs from the usual seasonal pattern. It is based primarily on the combination of NYSE solar-return charts and planetary transits, as described in Volume II of my books.
As always, astrology indicates probable market direction rather than precise index levels, and actual market movements may differ from these projections.
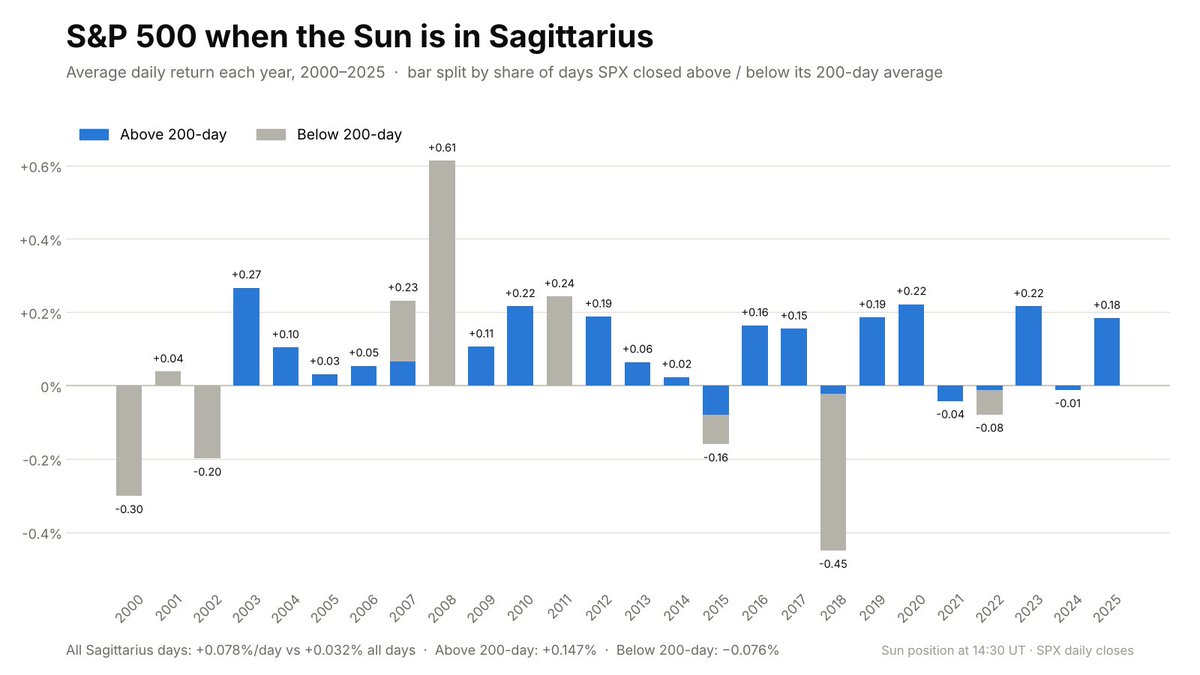
To explain this a little bit - in bull market years Sun in Sagittarius is very reliable, up almost every time. But a bear market environment is far different and much more at risk.
Probably everyone wants to know is the low in or not. Of course I have a lot to say about this very question, but what matters to me is -
Does SPX stay above its daily 200 MA (SOX, NDX & RUT already far below) in weeks ahead! Huge difference in the astro data on this.
@Gugu_the_Boss@TimeTrades1@AstroCryptoGuru@margo_amala Also, @TimeTrades1 specifically mentioned a 30% drop and that hit in semiconductor index. I specifically said institutions would be destabilized and that has totally played out. These are not immediately obvious, even with a double retrograde. We nailed it.
Bahahaha
Not laughing at suffering, but because our circle has totally nailed the market with our unique perspective which Wall Street & all these funds think is ridiculous. And if we gave a presentation, they would laugh us out of the room. So who's laughing now?
I think we can all agree the amount of hedge funds blown up is mind blowing. Clearly these were alpha funds w no hedge. Time to revamp the model. Seriously 30-40% drawdowns in a month WTF
What do you mean that was easy? In the YouTube I did with @TimeTrades1 in late August I thought AI fear would return in some way, and specifically mentioned data center delays. And in the Venus Rx seminar I did with @AstroCryptoGuru and @margo_amala showed all my data about why this configuration into mid-November would be bearish. Maybe I make this look easy sometimes, but do you think this was all easy?
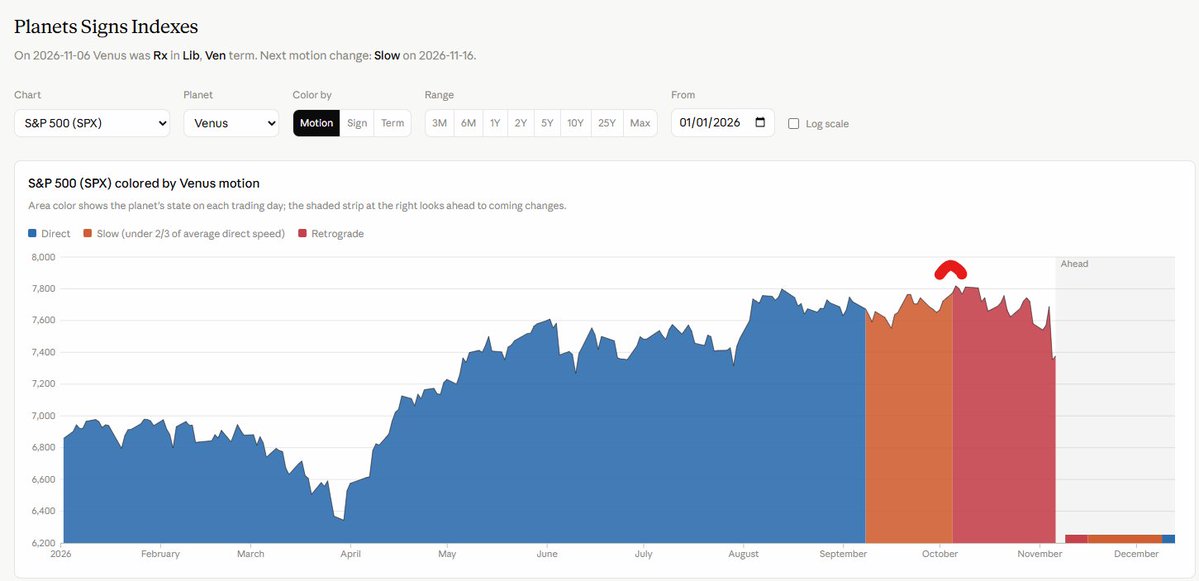
Long time followers know of my FREE Tableau Public profile that I built to show visuals on planet motions and prices.
The updates are a chore, and Claude was able to replicate a Planets Signs Indexes in 5 minutes!
Here are some Venus Rx shots, updated today!
SPX