I manipulate threads to load up your system, stress it out, soak up the memory, trying to leave a lasting footprint.
Then become a psychiatrist, analysing, telling you how you measured up and how you could do better.
📩[email protected]#LetsTalk#PerformanceTesting
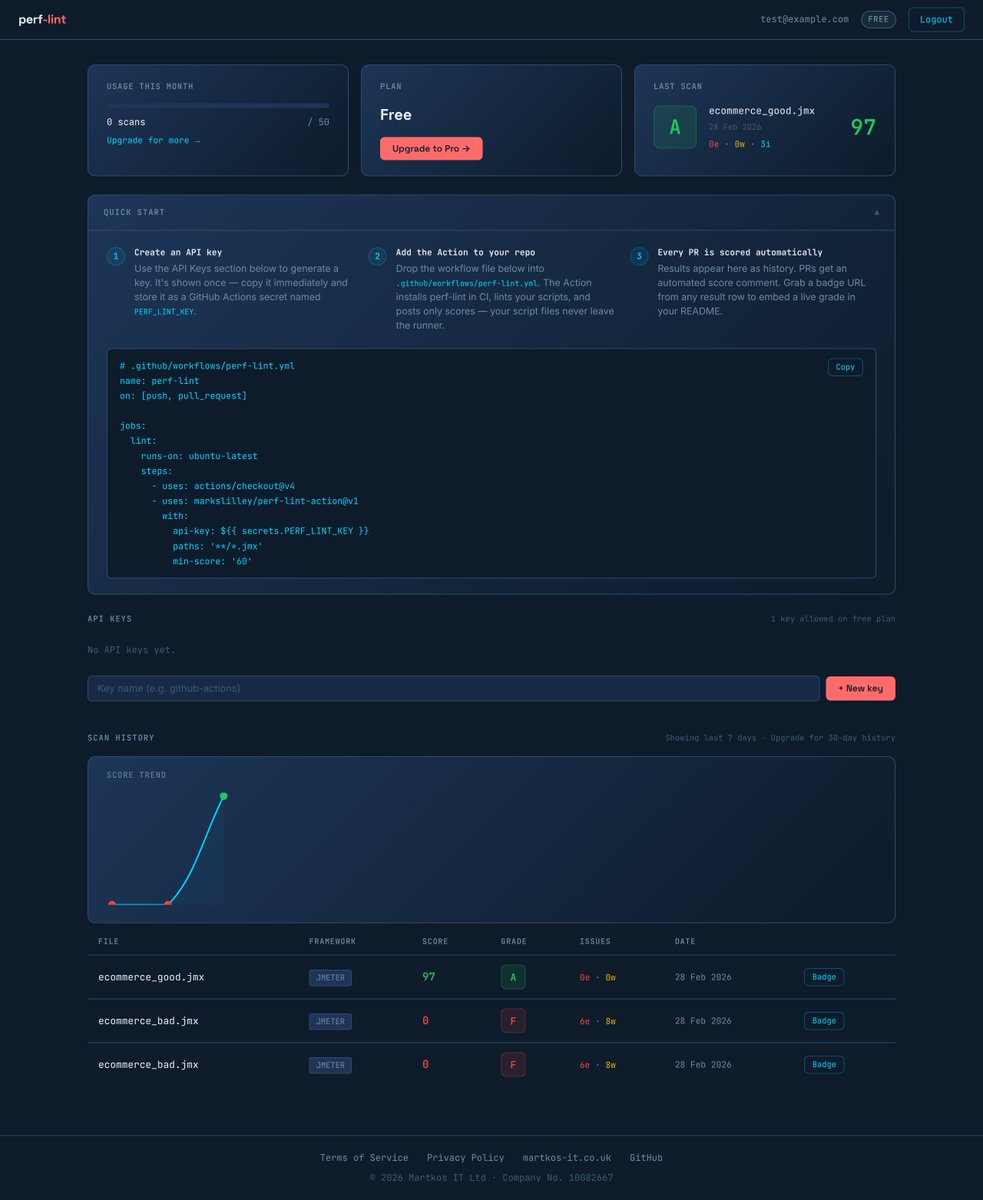
18 rules are free forever.
Pro & Team tiers unlock 35+ more rules (total ~53), 30-day scan history, and a dashboard to track quality trends across your entire test suite over time.
CLI, API, or plug it right into CI via the GitHub Action.
Try it → https://t.co/K8uMT9xMMr
When scripting it's easy to skip the basics: no think times 😴, hardcoded creds 🔑, zero assertions 🚫, weird ramp-ups 📈.
These silent killers make your results meaningless.
So I built perf-lint — a static analyzer that catches them before you even run the test.
Launch pricing — first 50 buyers only:
£29 Basic (normally £59)
£59 Pro (normally £99)
One-time payment. No subscription. Perpetual license.
Once 50 are gone at each tier, full price kicks in.
https://t.co/XgPyMN1an1
Spent 3 hours correlating a single OAuth login flow in JMeter.
30 requests. Easy.
1st replay: hardcoded auth code. 2nd: missed CSRF token. 3rd: a base64 session ID that didn't even look dynamic. 11 extractors later, finally worked.
So I built a tool to never do that again. 🧵
Built a test data generator that actually scales.
→ Pre-built datasets · CSV, JSONL, Parquet
→ Up to 10M rows · Multiple locales
→ Custom data generation when templates aren't enough👇
Built a Performance Test Reporting Dashboard 📊
Works with JMeter · k6 · Gatling
Drop your results file → instant insights: response times, throughput, error rates, APDEX score, SLA compliance, anomaly detection, and file comparison.
1 dashboard, 3 tools. Free to download 👇
Quickly see your JMeter JMX structure directly on the CLI. Quick modification or confirmation of values. Batch edit multiple JMX files....just make your CLI/TUI experience with JMeter so much more enjoyable and efficient.
https://t.co/7qUdOOnbqJ
Make rapid adjustments to your JMX files without waiting for the JMeter GUI to load. Ideal for CI/CD pipelines and scripted workflows.
Quick modifications to thread counts, duration, or endpoints in a TUI.
After years in perf testing trenches, I hit my 2026 goal: launched my own tools suite! 🚀
Tired of JMX GUI crashes, manual correlations, fake data pain?
Introducing:
• JMeter CLI Editor
• Perf AutoCorrelator Pro
• Reporting Dashboard
• Perf Lab Training
• Dummydatagenpro
🚀 k6 vs JMeter in 2026: Still a big debate for DevOps/QA!
2025-26 benchmarks key points:
• k6 efficiency beast: Go goroutines ~2KB per VU vs JMeter Java ~1MB/thread.
• 10k+ VUs smooth on single machine; 50-70% fewer resources → perfect for CI/CD pipelines.
2026 reality: Lots of teams hybridize (k6 for HTTP + JMeter for exotic/legacy).
Bottom line: Run a quick PoC on your stack!
Most agile/cloud crews leaning k6 for pipeline wins. JMeter rock-solid for enterprise breadth.
You team: k6 gang or JMeter loyalists? 👇
#k6#JMeter
This shell script can take a jtl file and split it into new jtl files containing only the period of time where the peak throughput executed. It will then create individual Jmeter HTML reports for each.
https://t.co/aonfEBiKYO
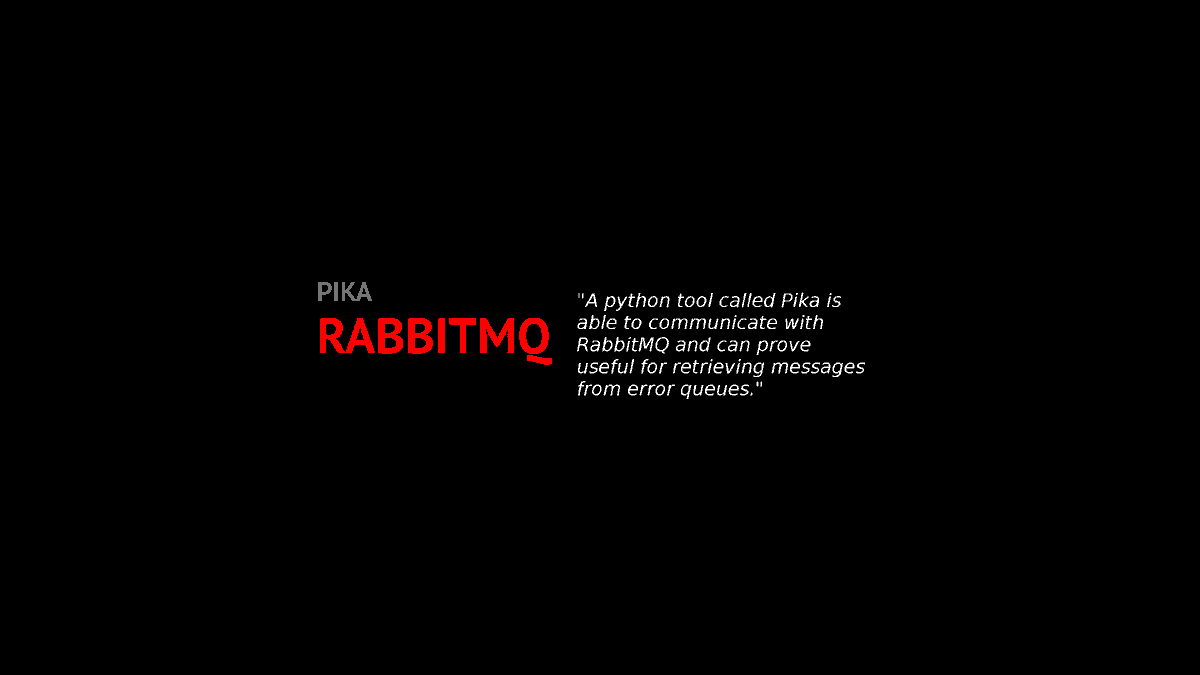
Pika - a python library that communicated via AMQP with messaging systems such as RabbitMQ.
A short example of consuming messages from an ERROR_QUEUE and writing them to a gzip file.
https://t.co/LxJcrTKULf