Add a like to this retweet if you would like to have an update with the boosters of this fantastic plot showing the age distribution of vaccinations in Belgium from @MathiasLeroy_ 🙏😊
I know a lot of you wanted a technical breakdown of this meme so here it is!
I don't think you will find this level of detail anywhere else so keep reading if you don't want to miss out.
This is getting ridiculous.
OISST provides a real-time daily index of ocean surface temperature (60 S - 60 N). For the last month it has been continuously reading higher than in any previous year and still shows no sign of settling.
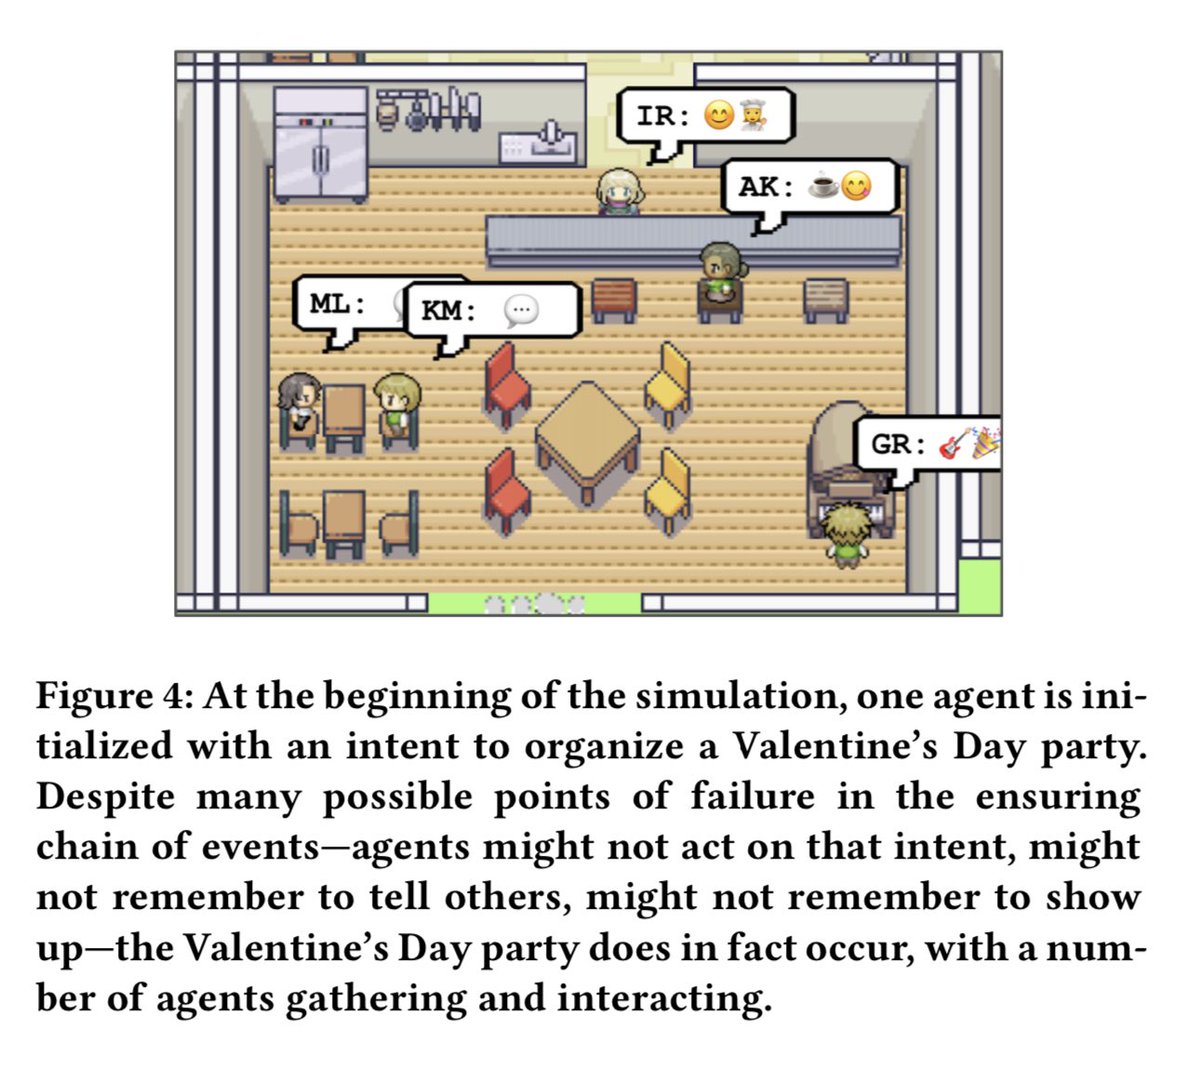
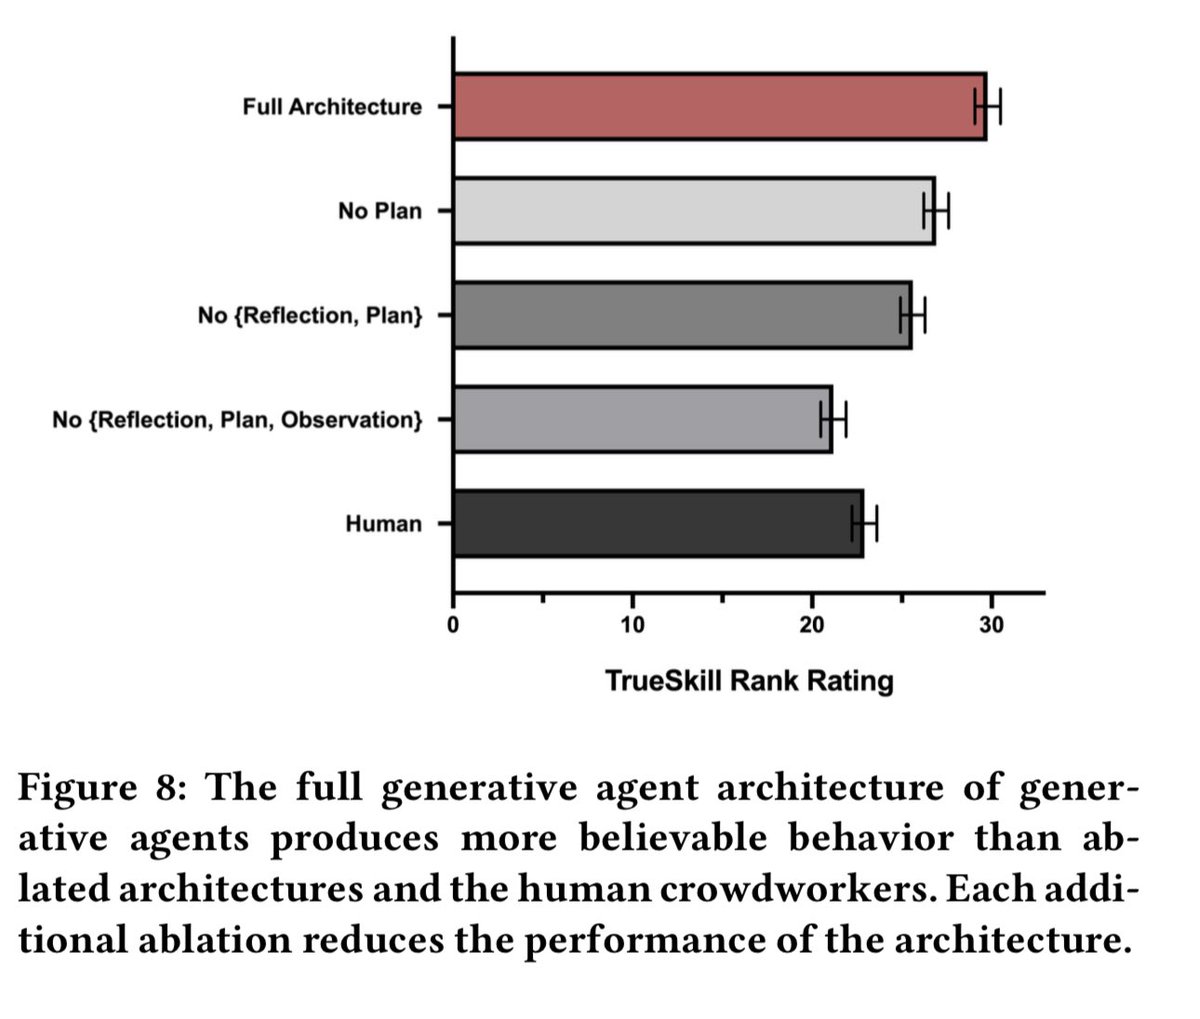
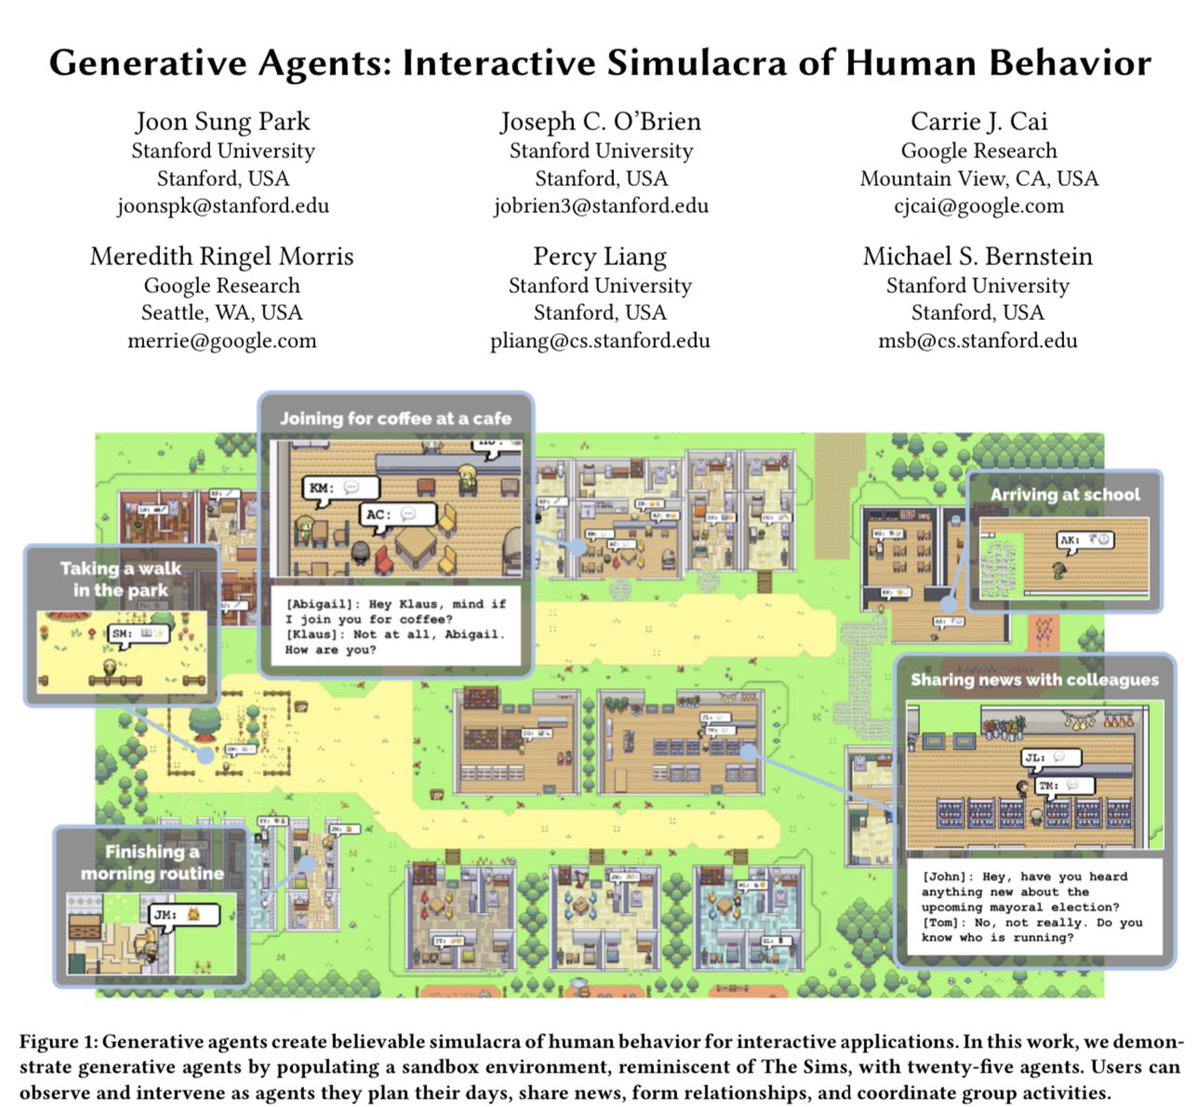
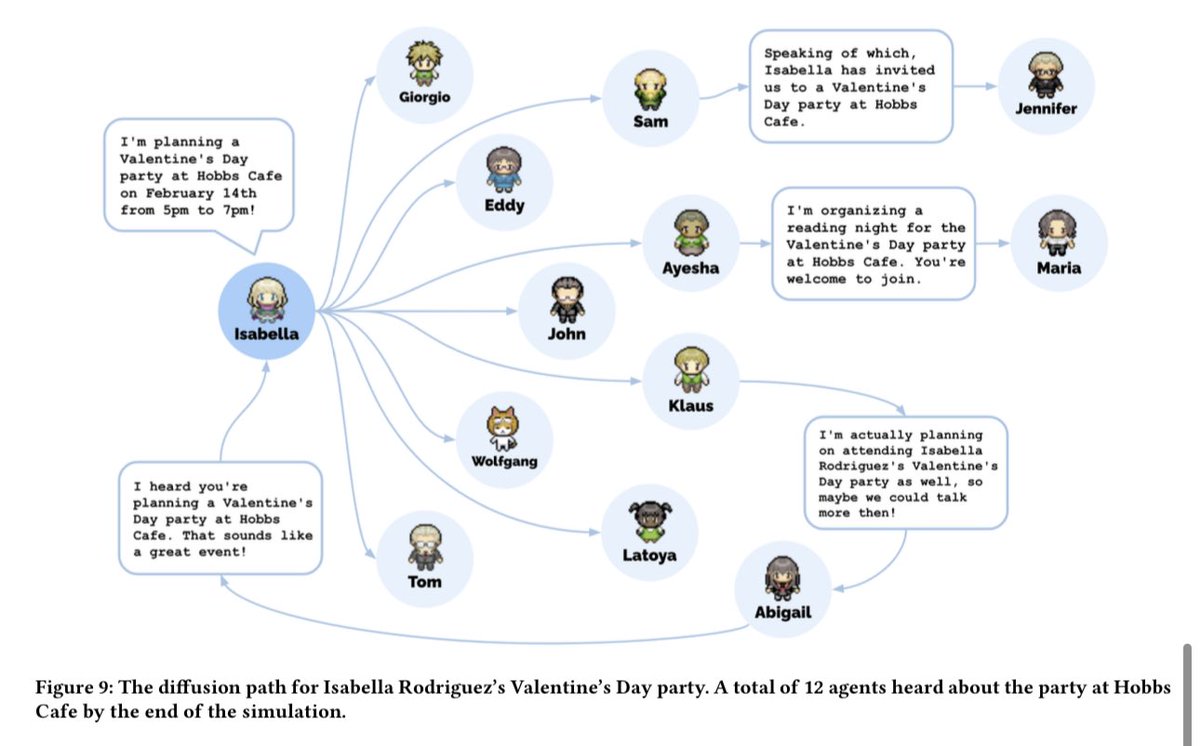
This is quite the paper!
It gave 25 AI agents motivations & memory, and put them in a simulated town.
Not only did they engage in complex behavior (including throwing a Valentine’s Day party) but the actions were rated more human than humans roleplaying. https://t.co/G7oJW1S3na
I got a prototype working for hot reloading with interactive code widgets. Roughly 40FPS. Really excited about this!
Could be a game changer for #dataviz work - no more typing numbers and saving files. Truly instant feedback!
Inspired by Bret Victor's "Inventing on Principle"
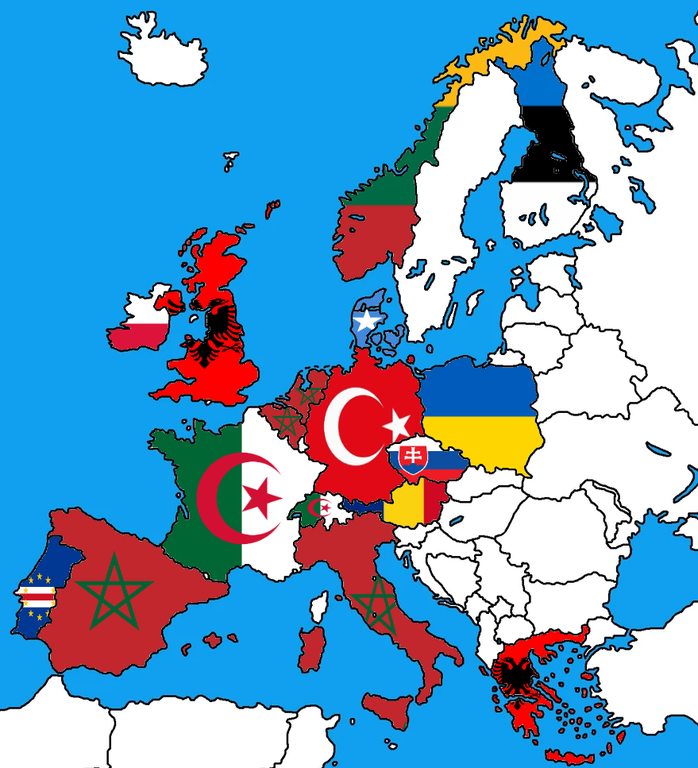
This evening's population density map is Belgium. If I make another error in this map, I'll stick to capital cities in future ones. And if I still make errors, then...then...I won't label anything ever.
#rayshader adventures, an #rstats tale
My visual experiment showing the global surface temperature anomalies over the last 130 years has been shortlisted for the Information is beautiful award #IIBAwards 🎉
#climatechange#climatecrisis#globalwarming
Happy to see my breastfeeding visualisation included in the longlist for the Information is Beautiful Awards. Good time to share too given it's National Breastfeeding week in Ireland #nationalbreastfeedingweek#iibawards#dataviz#dataart https://t.co/WLaXZy93Dj
@AmCaW @sciensano I'm not working at Sciensano currently, but definitely would like to learn! (I know already Vue though, is it worth learning Svelte?) I just don't have any application for it right now... I need a fun side project
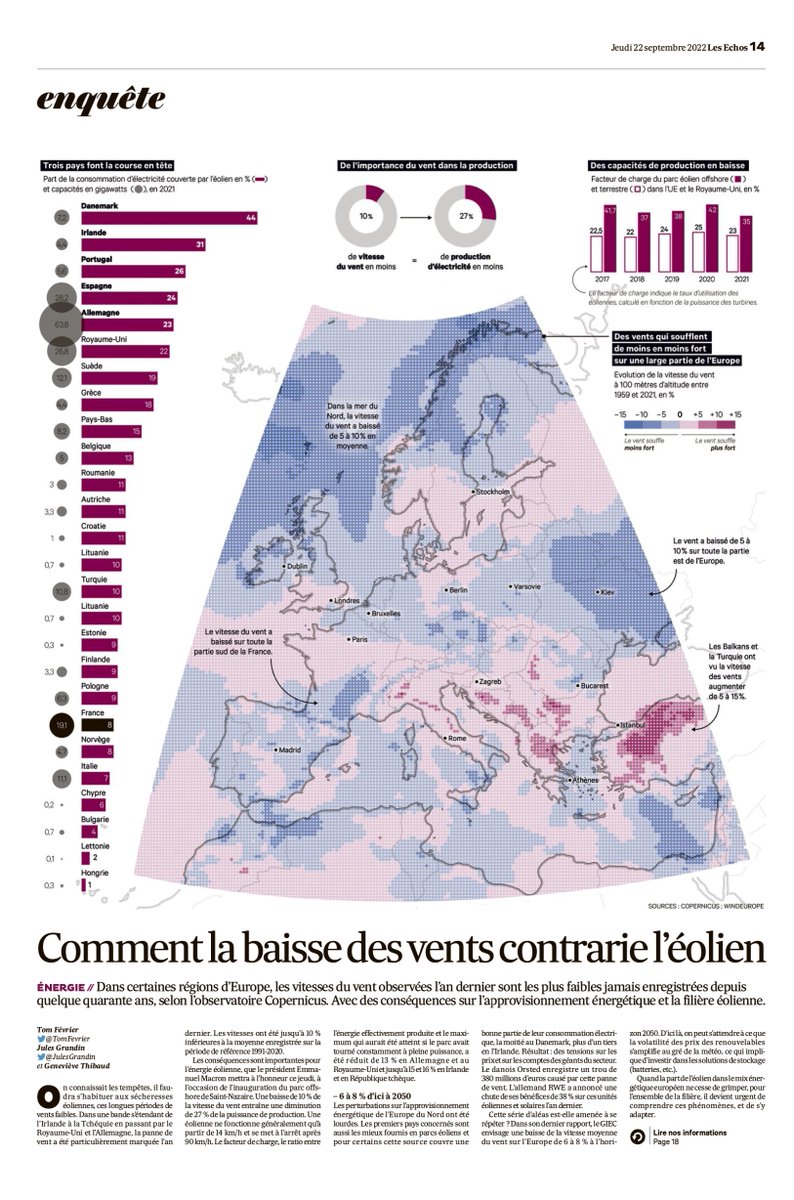
💨📉🌍 Saviez vous que le vent soufflait de moins en moins fort sur la majeure partie de l'Europe de l'ouest ?
Des baisses d'intensité allant jusqu'à 10, voire 15 %, qu'on a cartographié dans @LesEchos du jour avec @TomFevrier et @gethibaud ⬇️
https://t.co/MxP92T1VBD