$btc - 4 year cycle myths, debunked
The 4Y cycle of $btc does not mean it has to bottom in Q4 (september - december)
The 4 year cycle can perfectly co-exist with a bottom in Q2 or Q3.
Not quite sure why this is a thought going around so often where "the 4 year cycle believers expect a bottom in Q4". As if that is a necessitry.
Both are not correlated in any way and in fact this statement is quite an arbitrary statement.
It reminds me of the "shortening cycle theory" in 2021 (when we peaked in May 2021 and many thought it was over), then suddenly the "lengthening cycle theory" in November 2021 (when many people expressed over-excitement into the peak November 2021).
In fact, the 4 year cycle continued to exist, no matter the storm and no matter the story. The 4 year cycle will always continue to exist. But like any data in trading, it will often be misinterpreted to fit personal bias (confirmation bias).
In the same manner, the 4 year cycle is wrongly interpreted once again today, with the current popular and equally arbitrary statement that btc "has" to bottom in Q4 for the 4Y cycle to continue and to make sense.
Again an equally ludicrous and non-sensical statement.
Like any claim, don't just believe me, always look at the facts and the proof.
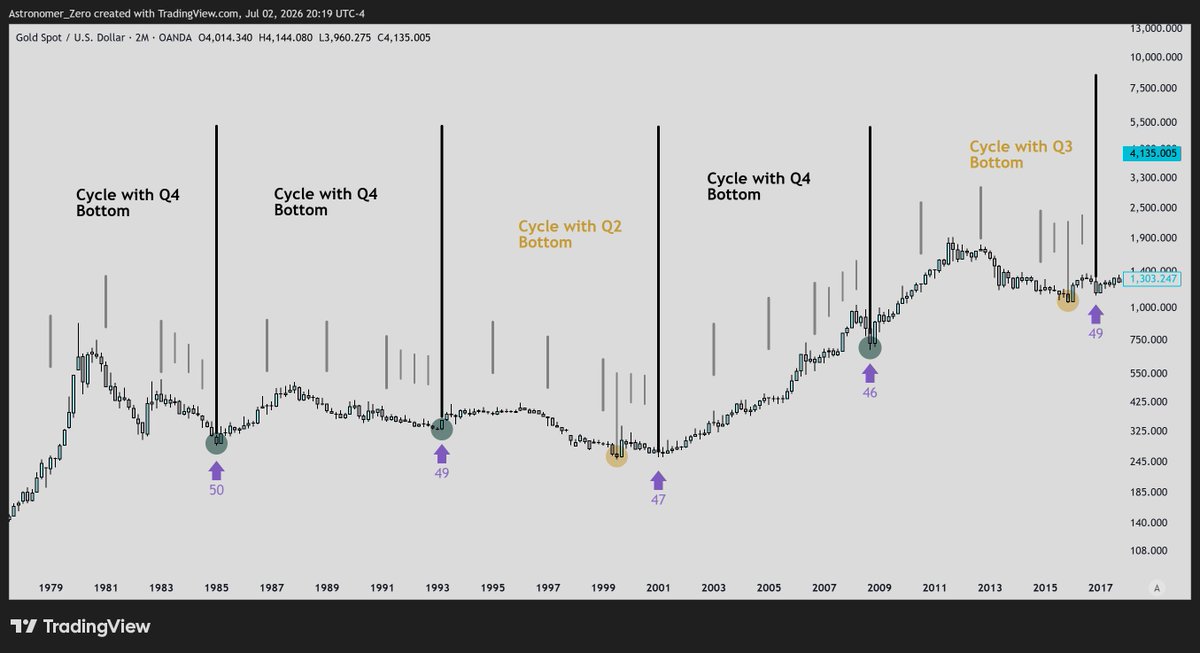
So without explaining too much further, data already shows very clearly when pulling up the 2M chart and performing the 48 candle count on gold (Gold moves in 4 year cycles, but has more resolution in 2 x 4 year cycles).
It becomes evident gold did not always bottom in the 4th quarter of the 4th quarter of its cycle.
And neither does $btc have to bottom in the 4th quarter of the 4th quarter in its cycle.
In other words, the bottom doesn't have to form in September - December for the 4 year cycle to continue its validity. The bottom may very well happen earlier.
That is why we never look at only 1 piece of the puzzle to extrapolate the puzzle. Instead, we find as many pieces as we can, to make a tradeable decision.
$btc longs (road to 66k)
At range low now. Weekend as good as over. ✅My position is back to original size again
Excellent morning to you all. Weekend is over, so I am back to original size (0.5x), ready to build from there for the road to 66k.
Apologies for the micro management around the weekend, especially to the ones who are new and never have seen a real trader at work in live time.
Long term followers already know how I treat my positions as if they were my own offspring.
Young ones need a good babysitter when the parents are away for the weekend.
🚨🇺🇸Rumor| Hay una nueva teoría de la muerte de Oliver Tree y Gaspi.
"Su objetivo de la C.I.A era Oliver Tree pero Gaspi estuvo en el momento equivocado..."
$btc
Last defence of our 60k zone and how to manage emotions during excess
While I am not here to inject hopium that my high timeframe silver channel (green on the chart) (+other confluences) will hold "guaranteed" and while it's more important to wait for a 7.12% bounce first before buying the retest there-after,
for educational purposes, I do want to share the journey of getting (close to) last defence and going through that process, how it "feels" and how to manage it. "feels" because anything you feel in markets is meant to mislead you so that must be managed at all times and especially during last defence and in excess periods.
Last defense and excess is exactly where we are now, we are still in the range of holding the silver zone and the lower end of my purple zone, but by "a thread" so managing emotions here is key.
Because it's that exact point zones look like they are "lost", htf indicators off lesser quality start to point towards bearish (yet they can still fake-out), and candles look at its worst. I ask you, why does that happen so often, whilst they still play out, and why is it so effective for markets to do that?
With this post, I just wanted to highlight exactly that here quickly of why this happens in markets fundamentally, a quick "hack" on how not to fall for it, as well as what to do about it.
This will help you prevent making mistakes or even reshape your approach/framework to make less mistakes at the exact times most mistakes are usually made. Especially as we are in high timeframe excess, where it can take a while.
Again, not to say I am "right" and it holds guaranteed, I am confident, yes, momentum is strong, also yes.
But disclaimers aside, and assuming it "will have worked" months down the line, and I am going to try my best to sail through all the other nuances, because after my bots scanned X for a while, I could not find a single post on the entire platform taking you through this exact process, most are only after it played out or not going in depth as to why htf zones that look like they are lost, aren't in reality. Especially true with the silver zone for instance.
Some of you may already have been through this exact process. If you were around when I brought up the silver zone at 123k (when it tapped), I was getting an extensive amount of backlash when price went to 125k (2k in excess), where I closed all leverage on my last bull market long, how I was "wrong" doing that, yet it still ended up working.
Same exact situation now, (again, not saying it will play out the exact same way, but I am confident, ...).
So realizing this mechanic, comes with valuable fundamental insights and understanding in the market, something I always aim to improve and push towards my close followers, as it gives you more confidence in trading and directly improves results, since your framework is supposed to be built around your logic.
So how come? What is the origin of this mechanic of excess?
Excess
It's all about timeframes and understand precision-power dynamics and trade-offs and how markets take advantage of that to explain "analysts/traders". Long explanations are possible. But in short: high timeframe are more powerful, but less precise and sensitive to price, low timeframe are less powerful, but more sensitive to price, therefore more precise.
That is why we use high timeframes to make a plan (as it stands, this area holding and confidently not seeing sub 50k), and use low timeframes to enter.
So regarding of monitoring a plan, and understanding that dynamic, it looks like the zone is lost, it looks like it's clearly going below it, and it looks like it's breaking down. But locally, it holds because all positions are in excess and institutions are extracting the exact excess liquidity at large amounts.
It's the same liquidity we saw at 15k, for people expecting 12k, now for 50/45k (reverse excess, not liquidations, but aggressive positions).
So, in the same way the market "looked like" it was doing that at the top of the channel, above 125k in live time, the same way it looks like it's doing that right now below it.
Quantifying excess
Important step, now that we are aware of it, as it helps you to know exactly when the move below is no longer excess. Before moving on, quantifying is useful, but monitoring is better because that shows the real time information. But say you don't have access to that, the back testing all bottoms/tops and notice how far excess went off key zones (learn from success i.e. the bottoms/tops for future success).
Without going too deep and just looking back one instance: excess at the top was just over 3%, excess so far now is just over 5%, still both in the same realm so this could very well be classified as excess.
So, it's not that the zone "doesn't work" or the 60k call "failed" (yet). The same way many said my silver channel at the top of 125k "failed", the same concerns occur now.
It's because of the local view and mixing up timeframes. All it takes is waiting for the monthly close, and suddenly it looks less bad.
That is why we always execute on a lower timeframe, and use the high timeframes as plans, unless you use a broader invalidation, accomodating for excess of course. Either way, being able to imagine excess, how moving beyond and reaching that moment where it looks like it's breaking down (but it hasn't), imagining what it will look like (future projecting) will save you more than it hurts you, therefore increasing your performance.
And this is exactly why I still prepare mentally for a bounce, imagining how it will play out followed by expecting a retest to buy, in the midst of excess and when most have already given up.
That's the elegance of separating execution with plan, and linking both together during the ever so often occurring edge cases.
I present to you this very occurrence taking place now potentially (if successful), a crucial snapshot, one to come back to (if successful), for your future reference.
$btc - htf data analysis
There is a 98.4% chance bitcoin does not go below 50k on a volatility adjusted basis.
In the light of our last post on #bitcoin's infamous electricity cost metric, where we called the bottom once again before a whopping 37% move all the way to 83k from the very bottom of 60k, called out live, all due to one of our most important signals passing by, I decided to go deeper into the analysis.
With all the random numbers thrown around, vague calls and loud celebrations of how the bears "called" this entire move proudly, and with that same conviction, expecting 50k and below, I think what people need the most right now, is at least one solid metric + data shared, describing how that happening, is a highly unlikely chance.
Good data and strong data in general is hard to dispute, but I still give the kind disclaimer that this is just my lens applied to that strong data. There are multiple ways to interpret data. With this one though, no matter the lens, interpretations are quite narrow and I think that's the very way to approach data analysis in trading.
I always find it quite funny when someone posts a chart of 3 data points, then concludes that the 4th one is a guarantee, whilst anyone who followed high-school statistics, knows otherwise, how 3 times 100% chance, doesn't mean 4th time, in a probabilistic world.
So with this post, I like to offer strong data, as well as explaining the logic behind the data (to remove the black box data-only effect), of why I am so confident we don't go below 50k.
Thank you in advance for this more extensive read. I am sure you will enjoy and some of you may feel some nostalgia every time I share a post like this given my historic reputation on these.
Without any time wasting further, let's get to it.
The logic
This one is about the miners electricity cost to produce 1 $btc. This is a vital metric. Now I know there is a lot of controverse around miners and their impact, but there is still an inflation of 0.84 per year on $btc to date since the last halving (about 164,000 BTC per year). Seems negligible but at the current price of Bitcoin (61k), that still equates to 10.7 billion dollars per year. So every year, 1/6th of the entire supply of @MicroStrategy 's entire holdings gets released into the hands of the miners, and with $btc's thin liquidity existing to this date, you wouldn't want to see that dumped on the market, certainly not every year. So yes, the miners still have a very important impact that can't be underestimated.
Put differently, that equates to @MicroStrategy's entire holdings being sold every 6 years (1.5 cycles long). If that doesn't put a different swing on the significance of Saylor's actual influence on the market, I don't know what will. And I believe I have convinced you now how impactful and in control the miners still are today. (In fact, I don't need to convince you, the production cost floor speaks for itself, still until today.)
So you don't want the miners to sell (which they mostly do, slowly, to keep their business running). But due to the current situation, they can't do that anymore, because the market has hit rare conditions, only happening a few times every cycle.
That is, the price has dropped below the average weighted electricity cost to produce one bitcoin:native per kWh.
Significant? Maybe. Let's put some logic behind it: Not only does that mean that the miners can't sell their $btc for a profit. It also means that it is simply cheaper to just log into a CEX (large funds: OTC) and buy 1 Bitcoin, instead of going through the pain of mining 1 Bitcoin. So not only does this make the miners (the people controlling $btc) not want to sell, it also makes them want to buy, because it is cheaper to just buy instead of mine them. And although I am not saying that is what they do, it is a large pressure and narrative on the market, which has driven price north without any deeper revisiting each and every time in history.
That is the logic behind why this works. Should we believe it blindly? Never. Successful trading and analysis is always a combination of data + logic and cross verifying two., never of just one or the other. But let's call it an assumption (assumption 1).
I could not write on one slate the amount of charts and videos and posts I see on X every day, only covering aspects of just one of the two, in mere lazy manner too, just throwing numbers around, or using complex risk metrics or equations without any logic behind it. It hurts the seeing eye.
All power to them however. Many are learning, many are adapting and many don't even trade, they just DCA and draw some charts telling everyone how they are "mostly right".
Short rant aside, logic by itself is strong and often missing, but we need data to verify logic (hypothesis) correctly.
Collecting data
How to do this? It's very simple. To compare how price compares against the continuous band of production/electricity cost, all it takes is simply mapping it out on a price-time chart on tradingview, which is the purple band represented below, starting with the production cost and the electricity cost as the floor. The production cost is higher due to mining equipment, and that cost also varies since mining rigs are tuned to performance, therefore cost, that is why a wide band appears. The electricity cost is the floor because that is disregarding capex into mining equipment, and electricity cost per kWh (worlds average) doesn't vary much over time.
What we also notice is how the elec/prod cost rises over time, due to two drivers:
➡️The halving (every halving, it becomes more difficult to mine 1 BTC, giving a large jump)
➡️ General competition (adoption driven, more miners = more competition for blocks).
Both feed the eternal adoption cycle of bitcoin and rising floor price (unless abandonment, the opposite of adoption happens, let's hope not, but there are clear signs it's not happening).
So, mapping out the elec/prod cost and simply comparing how far price bottom above or below each time it visited, gives us a statistical reference to where price will bottom now (or where it is unlikely to go now).
It is indeed a mere statistic, because volatility is somewhat statistically driven, intertwined with cycles.
One key note: volatility adjustment is important.
On that note, collecting how far the wick goes below the band each time in absolute sense, is not sensible enough. It is to its simplicity elegant, but price also needs to be adjusted for volatility because for example daily 40% up and down moves Today are far less likely than back when $btc was priced 1$ per coin. Anyone who ever traded microcaps or penny stocks, knows what I mean. So since we are using the entire population as back test data, we must adjust price for volatility.
How to do this? By price law books, the relation depends on liquidity (how thin it is), the operators controlling the markets and the time in the year, day, week. But in general terms, liquidity thickness is linearly proportional to volatility and volatility scales inversely with the fourth root of price.
What does the latter mean? If price doubles, it means volatility decreases with the fourth root of 2, which is 1.1892...
So when price wicks below the band in say 2015 for 20%, that means today, when adjusted for volatility, that difference should be 61k/whatever the price was in 2015. E.g. $61000/$250 = 244. Fourth root of 244: 3.95. Which means the 20% wick should be accounted for as a 5.06% wick in the data.
Keep in mind, this is a relatively rough assumption (assumption 2), but one backed by price-liquidity-volatility laws.
So throughout the entire history, we collect these data points of how far below or above the wick went relative to the electricity cost at that time, and compare that to the chances of reaching 50k now, by comparing how much further price has to go below the current low, which is 61.1k, conveniently aligning with the exact electricity cost of 1 $btc today.
Using 61.1k as the in-real-time of writing this post, that puts 50k: about -18% below that.
That sums up how to collect the data.
With assumptions again renamed below...
➡️ Assumption 1: the logic of miners' impact
➡️ Assumption 2: volatility decreases with the fourth root of price (market cap).
➡️ Assumption 3: normal distribution of random volatility differences around a given price point...
... we are ready to collect the data.
Data Analysis
Next, let's look at the data, let's look at the history, where I will be taking every single data point which has reached inside the production cost band as a high timeframe bottom data-point. Because frankly, as it speaks for itself, it has been a high timeframe bottom every single time.
Below, are all the data points, sorted by date (Monday starting the weekly candle), % wicked below (-) or above (+) the lower edge of the band, and its normalized %, normalized by the square root of volatility (assumption 2).
Date │ % wick (-) or (+) lower band │ Normalized %
➡️12 Jan 2015 │ -12.46% │ -2.83%
➡️17 Aug 2015 │ -26.41% │ -5.99%
➡️1 Aug 2016 │ +1.54% │ +0.45%
➡️9 Jan 2017 │ - 12.44% │ -4.30%
➡️20 Mar 2017 │ - 7.21% │ -2.56%
➡️10 April 2017 │ -11.26% │ -4.42%
➡️10 Dec 2018 │ -26.80% │ - 13.81%
➡️9 Mar 2020 │-26.45% │ -14.38%
➡️9 Sept 2020 │ - 9.22% │ -5.98%
➡️ 7 Nov 2022 │ -0.67% │ -0.47%
➡️10 Dec 2024 │ +8.47% │ +7.74%
➡️2 Feb 2026 │-5.45% │ -5.44%
Using the volatility-liquidity adjusted %'s into a mean and assuming they are normally distributed, which, in argument with a Poisson distribution, is acceptable. Both distributions lead to similar results, but a normal distribution is more lenient towards random events revolving around a centreline (here, the bottom line of the production cost band), hence my choice.
The mean is -4.33%. The sample standard deviation is 5.99%. However, we chose every single low so we opt for the population sdev, since we do indeed have a sample of the entire population. This sdev is 5.74%.
Within this population, the z-score of 17.16%, which is the excursion needed from the current low of 61.1k (which also aligns with the perfect bottom of the band), to reach 50k, is -2.14. This equates by law of statistics: to 1.6% chance of reaching 50k, a low chance.
What if we use the non-price adjusted volatility %'s?
Then the mean is −10.70% and the sdev is 11.69%. In this case, a -17.16% lower excursion from the current low of 61.1k, to 50k, has a z-score of -0.55. This aligns with 29%.
Conclusion
The chances of never reaching 50k or below are 71% when not adjusting for price-volatility and only 98.4% when adjusting for price-volatility. Let's be realistic, and choose the exact middle between both chances, which is 84.7%. Still a very high chance, more than enough to look for aggressive involvement.
So personally, regardless of whether my assumptions are correct (98.4% chance of no 50k), or are not (71% chance). I personally believe expecting lower than 50k is hopeful and wishful thinking to its peak. And this valley is just a mere opportunity for the bears to be loud and proud again, before absolutely missing the chance of lifetime opportune buying prices once again.
We take a look at the timeline, we take a look who is clearly and loudly bearish, who is loudly bullish, we mark them on the chart, and realize when extrapolated to the entire world, both are majority disfavouring proper data, in my humble view.
We look some months down the line, and see where we will be, and whether talking generally bullishly, or generally bearishly was the smartest move to flourish in the world of crypto finance.
$btc spot plan update - an important real-time executional deep dive.
When I will buy spot buy 2 exactly, with exact execution specifics, and what it means to wait for "strength" (exact specifics).
Good morning. Here is an update and in real time execution hybrid post to help you during these times. Because after losing my daily zone, longs invalidated, we recognized a big drop into the green zone is coming + we need strength in it too. So I think right now as we are in that special place where "prices are low" but we are still rushing down, fomo can cause you some stress.
Especially as I did talk about buying spot and how I am interested, you may think "oh, Astro is interested here in buying, so let me buy". And when you are a new follower, not knowing that I call out everything live and that I am not one of the influencers who draws a chart and only quotes it in hindsight after the fact, calls everything "psychological operation" or other schemes, without telling the exact moment of buying live, then you might get stuck in your blind buy off my plan wrongly and come back to me with wrong ideas.
I am all about clarity, so this is mainly a message to the new followers.
But also a message to my long trusted and veteran audience, who may be very interested in how I want specifics in this case, what I look for and when I buy exactly, not to copy me because you know when I will call out the entry of spot buy 2. But out of interest to have an execution plan in place, you may miss my exact buy while asleep or just want to learn what the best way is to buy bitcoin without getting caught in the trend.
So what I think many of you need the most right now are my exact predictive execution specifics, of what I need to see, so you don't get caught buying early (or late). Specifics are important in trading. You know how I don't like dubious statements. I wish you a warm welcome to my account.
I'll also add my comment (reminder) to "when bounce" just as my prediction. With the kind reminder that in this situation, my prediction is bold and can be wrong and if it's wrong and you blindly buy because of my plan, then you can end up losing heavily. Even if my plan is usually right, my belief of holding the exact daily zone for example, was wrong and as soon as we went below it even briefly, it resulted in a large move.
That is why you need execution specifics, and that is why I also call my entries out live because they are a confirmation of the execution and local specifics being triggered.
I believe this post will help you limit your fomo drastically if you have never hear me talk about it. Therefore, reduce your stress drastically. And have the ability to interpret mine, or your own plans just that tiny bit more, sharpening your trading skills in a real way, not in a false path/bad data/one liner/"dubious" ways as we often see around.
Continuing...
The workflow of waiting for strength is always the same:
➡️Plan (predictive) and expectations. This is your edge, core system and beliefs based on data and logic
➡️Execution specifics: These are the exact specifics to look for.
➡️This is recognizing the specifics and pressing the button cold and clean.
This workflow is the same every single time, for trades, investments, for perps, for spot.
Many of you may know this workflow of me already. But I want to remind you because now is an important time to do so.
And because for spot the execution specifics are rather simple, no better time than describing them now. So I am going to describe them exactly to help you get the best possible spot buy with the least amount of fear and stress. Because buying now can feel stressful, so spoilers first: I have not made any entries yet call yet. So those who know me already: I haven't bought yet. I will also reiterate my plan before that, but again, to not take it as the holy grail, especially now since my plans can be bold.
To top it all off, you all know I will call out live whenever I do perform my spot buy as well, of course and this is also the case for this buy.
Once again apologies for the long intro. But it's an important one because nuances and interpretation in trading are important. Now let's get to it.
Plan (reminded):
My plan and prediction I already mentioned Yesterday: which is to expect 65k region to hold, and to get a bounce before we hit 65k. Hold that bounce and carve out the bottom. Again, very bold, very cold and could be invalidated in just days time with this momentum. But it's my prediction and therefore valid until it's not, just like my daily zone was above. I am a "delusional" believer of my plans, I always am, until the second it gets invalidated and then I abandon them immediately. My trading in a nutshell. With always execution in place which enables that, in case of plan invalidating, my execution never runs me.
The 65k plan, as of today and writing this post, it still holds. But we need exact execution specifics.
Exact execution specifics
How and when am I going to buy? Without spending too much time as to why, I have my reasons, but no time to share them now.
What matters is: to wait for a bounce of at least 7.12%, measured from wick down, to top of the bounce. Why that number? Again I have no time to explain. But this bounce is one that will be clearly visible on the daily chart. Then, after that bounce, I look for it to top out. And only on the retrace, is when I look to get involved.
Wait for this is perfectly non-dubious and easy to perform for everyone because anyone can use a measuring tool and measure the current % of the bounce given. It's currently at 1.5% off the current low, nowhere close to 7.12%, nowhere close to being visible on the daily chart (or any other timeframe of your interest, timeframe is key).
This waiting period is what we are in now. This is a very crucial period because waiting is hard for many. Which is exactly why I am writing this post. I am teaching you "how to wait".
Once this happens, (and that is a big condition, but once it has...), it's key to wait. Do not buy the bounce at 7.12%. Wait for a retrace. which, yes, will come.
That's right, wait... even if it bounce up to 30%.
"What about V shape recovery, then I will miss my entry forever". Valid point. But even those are covered by the retrace I am talking about.
Which exact retrace am I talking about? It's the one leading to the 0.5x fib. Not exactly sharing what that x will be. It's not of importance now regardless. Waiting for a 7.12%+ bounce and at least the 0.5 is going to give you much better entries in your trading and investing life than buying trends down blindly out of fomo.
I highlighted the gold circle of the last occurrence this crucial sequence of combinations took place. Feel free to back test this more. You may notice this is often the best time to buy some spot, and at the very least, a lot better than buying spot or calculated longs into the trend blindly.
Brief summarizing comment.
So, that's it. You simply wait for that to happen, and then you buy. Do I expect a bounce soon? Yes, I expressed that. But has it happened yet? No. Have I acted yet? No, I have not bought spot buy 2 yet.
What about the long, astro? Indeed, that is a bold enactment of me expecting the bounce and trying to capture it without looking for local confirmation, which is what I would do normally, but not in this case.
I expressed the long as bold, risky and with an attempt to capture the bounce, clearly, and in advance.
Such aggression with longs is more acceptable because the goal is to capture the first bounce for starts. Whereas when you wait for strength, you lose that ability to capture the bounce. But because with these spot positions, it's simply buying for longer term, so there is no need to capture the bounce.
If there is no need to take a risk, then that risk should not be taken, which is the mindset of this post and my trading.
So here you go. A post full of key mindsets that I use, and key numbers. Very much applicable in your general trading on all timeframes.
In this case and with the problem at hand: to perform this spot buy (or perhaps a long buy if you are waiting and didn't feel like copying my long buy). I hope this helps you limit fomo if you are looking to deploy. I also stress how waiting for a long instead in the same situation as this intended spot buy, if you are novice or not feeling as bold as me or can't afford a risky long at the moment, is also acceptable.
Enjoy.
$btc
Putting some money on the line again.
Wider SL, but a hard SL because this is a knife catch and bold play without all too much local reaction yet.
Could technically become our sixth win in a row, risking the streak.
But that streak is just for the thril. There's no ego in trading.
Nothing big but real money is put on the line.
Classified as "risky longs".
Won't manage this as a trim -> tp type of trade, instead a 70% close as close as possible to the top of the bounce + leaving small renmants if the bounce turns into something surprising.
This trade could be a journey and one I'll have running in the background so keep that in mind.
#Bitcoin: How many times have I said the crash starts from the 80–85k region?
How many times have I called for shorts in this region?
How many Sunday Reports have I published and explained it?
🚨 El mercado no construyó las autopistas de EE.UU. No construyó el tren de China. No construyó los puertos de Corea. ¿Por qué va a construir las rutas de Formosa?
Un camión sale de Tucumán con limones. 🍋 En un país normal tarda 14 horas en llegar a Buenos Aires. En Argentina tarda 26. ⏱️Esas 12 horas de diferencia no son un problema de tránsito.
Son el costo exacto de décadas sin política de infraestructura.
🚛 Argentina mueve el 93% de su carga por camión
🚂 EE.UU. usa el tren para el 40%
🚂 Brasil para el 30%
🚂 Argentina para el 5%
El resultado:
📦 El flete se lleva entre el 30% y el 62% del precio final del producto según la región. 📦 En países con logística competitiva: entre el 8% y el 15%.
Eso es una transferencia de riqueza desde el productor del interior hacia el lobby del transporte.
Todos los días. Sin Decretos. Sin titulares en medios. 🗞️
Mientras tanto:
📉 Más de 3.500 obras públicas paralizadas desde 2024 📉 120.000 puestos de trabajo destruidos en construcción 📉 Déficit de infraestructura acumulado: más de USD 100.000 millones
Y el argumento oficial es que el mercado va a construir lo que el Estado no construye. 🤡
⭕️Ningún país del mundo construyó infraestructura de integración territorial solo con inversión privada.
❌ Ni EE.UU. con sus autopistas interestatales. ❌ Ni China con su red ferroviaria de alta velocidad. ❌ Ni Chile con su sistema de concesiones.
No porque el mercado sea ineficiente. Porque la rentabilidad social de integrar un territorio siempre supera la rentabilidad privada. En todos los casos documentados. En todos los continentes. En todos los modelos económicos. 🌍
La pregunta correcta no es si Argentina puede pagar la infraestructura que necesita. 💰 Es si puede pagar las consecuencias de no tenerla.
Y la respuesta la grita el camión de limones que tarda 26 horas. 🍋🚛
🔁 RT si creés que el interior argentino no puede seguir subsidiando la inacción con sus costos logísticos.
$btc
Shorts now fully closed.
Quick note on the shorts. Not going to give any extensive detail, I'm sure some of you are tired of me talking about them the last month.
But we still had 10% running. And with this trade up 18.25 RR, that's worth an entire trade on its own (1.825 RR). So I'm glad to announce that the wait is over, we reached into the entire trends golden zone, silver zone, a local avwap, and we have just taken out May's low on monthly open, with weekly open above.
Those are a lot of confluences, almost enough for another long. But first, time to close shorts.
Goodbye, it's been nice holding them for almost an entire month. Won't be interested in any large swing shorts like this anymore in a while as you know. Longs only next per plan.
Per my daily (and weekly) bullish bias. Another big announcement, is that I am also interested in spot again, which I also look to buy our second macro buy into (if you remember, the first one was placed at the start of Feb).
The enrollment begins, releasing the Astro Order Flow & Institutional Framework, my deepest and most complete execution system.
Stop finding good trades only to enter them poorly.
Stop watching your idea play out without trading it.
And stop letting execution be the reason a profitable plan becomes an unprofitable result.
Instead, use my own personal, institutionally-inspired execution framework, built, refined, and traded by myself every single day...
...and rapidly become a more precise, confident, and consistent trader through my private guidance on mastering institutional positioning, liquidity targeting, order flow, and professional execution
➡️A simple-to-follow, fully detailed framework focused on entering, managing, scaling, monitoring, and exiting positions with confidence and precision.
➡️Built on sound market logic (institutional positioning, liquidity engineering, execution theory, market maker behaviour, order flow interpretation, and my own private execution methodologies).
➡️Designed to eliminate uncertainty during trade management (entries, scaling, partials, invalidation, risk removal, and trade monitoring).
➡️Real-world execution models (Core entries, Duplets, Triplets, convergence positioning, liquidity targeting, and advanced management techniques).
➡️Lifetime private mentorship group with ongoing guidance to master the framework.
➡️Focused on execution, the one area every trader can improve regardless of skill level.
✅Institutional execution principles explained and shared in practical terms
✅Forged through years of study, testing, refinement, and live market execution
✅Directly applicable to swing trading, scalping, investing, and portfolio management.
💸 Price: $422
👤 Limited entries only (to protect liquidity integrity)
First come, first served, based on payment time
💳 Payment (Crypto only)
USDT/USDC address (Solana network):
8ENz93hYYeVAtRYcoB8MGpqGjHg3iYpr12TCuWgppn7F
📩 Send a screenshot of your payment in my Twitter DMs to claim your spot
I’ll provide all invite links and lifetime access
And you'll gain direct access to mentorship focused on confident, precise, and professional execution.