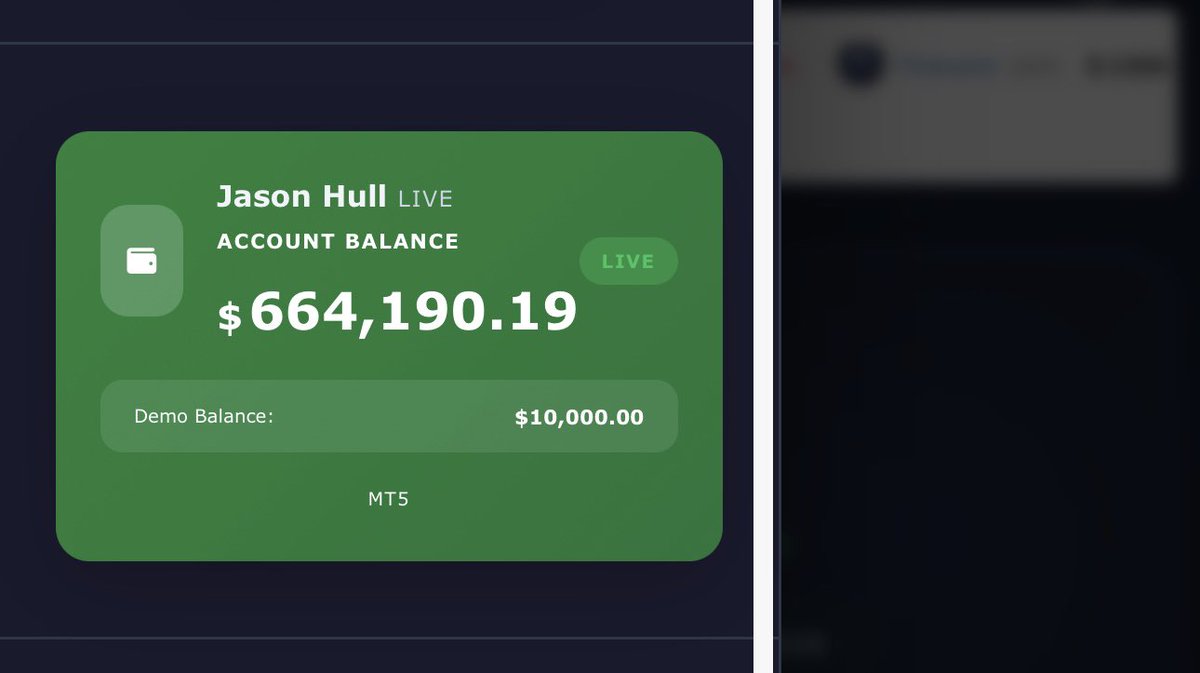
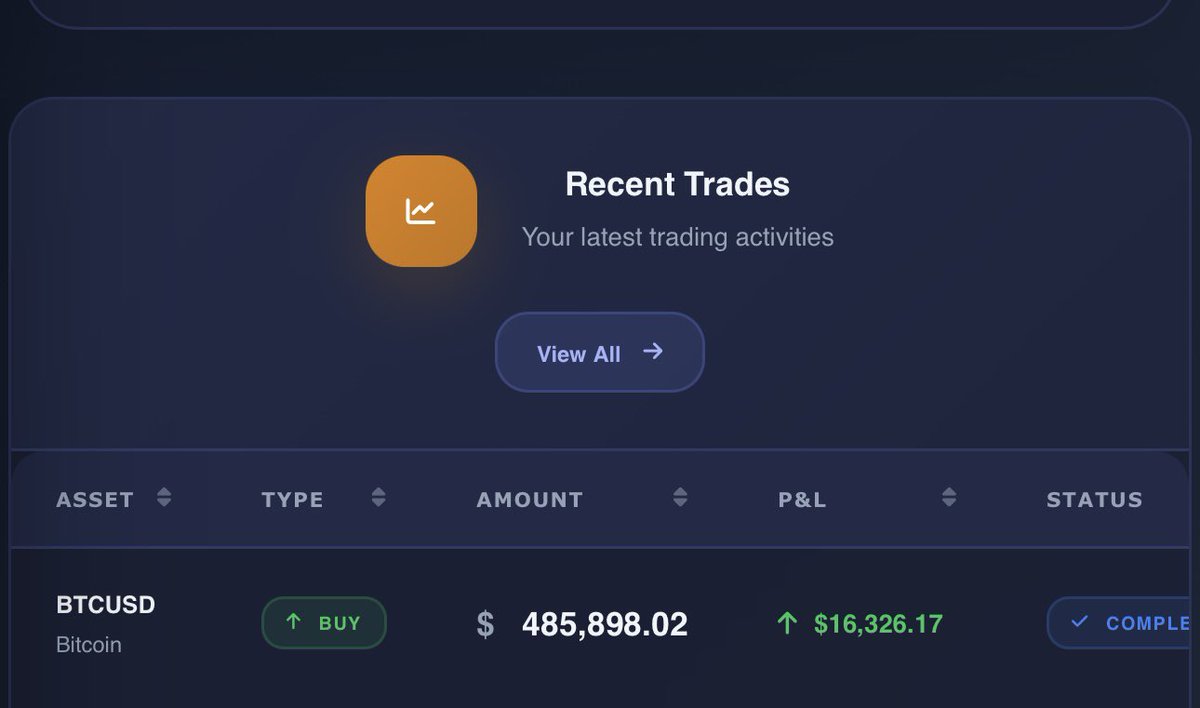
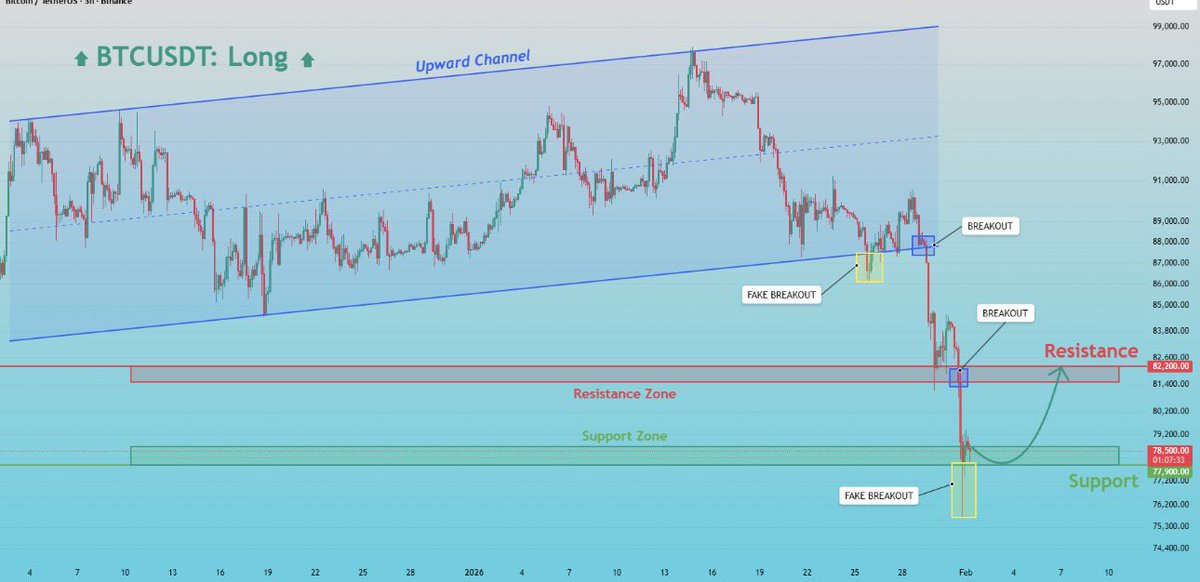
Today, I earned $16k from a single $BTC / $USDT scalp trade. After the trade closed, I didn’t spot any other high-quality trade signals, so I decided to step away and enjoy the rest of my day.
This software dip is getting insane
• ServiceNow $NOW: -35%
• Salesforce $CRM: -30%
• Adobe $ADBE: -50%
• Microsoft $MSFT: -20%
Which one are you buying?
$NVDA The drops are getting bigger every minute. I wonder if this'll recover towards the end of the day, or just crash even harder. Wouldn't be surprised if the bottom would crash out at some point, people don't have faith anymore, which is needed for recovery.
$TSLA It's just closed the 402-406 FVG from November. Coincides with bottom of the daily trendline and the bottom of Keltner Channel, and the fibs, so a good place to really bounce, but today is tricky with the overall market so weak.
S&P500 Channel Down pulling back to the 1D MA100. The S&P500 index (SPX) has been trading within a 2-month Channel Up and despite yesterday's strong recovery on a 1D MA50 (blue trend-line) rebound, the price is correcting equally aggressively today.
Note •
Not in so far. I would like to see price coming down to the CIB-Line, where I would enter the long trade, IF I get a momo signal, like a higher close of the momo-bar.
Because if there's not enough Gas in the Goose, what's the reason to risk a stop out? I will follow the trade to the end, even it I'm not getting stopped in to it.
$NVDA
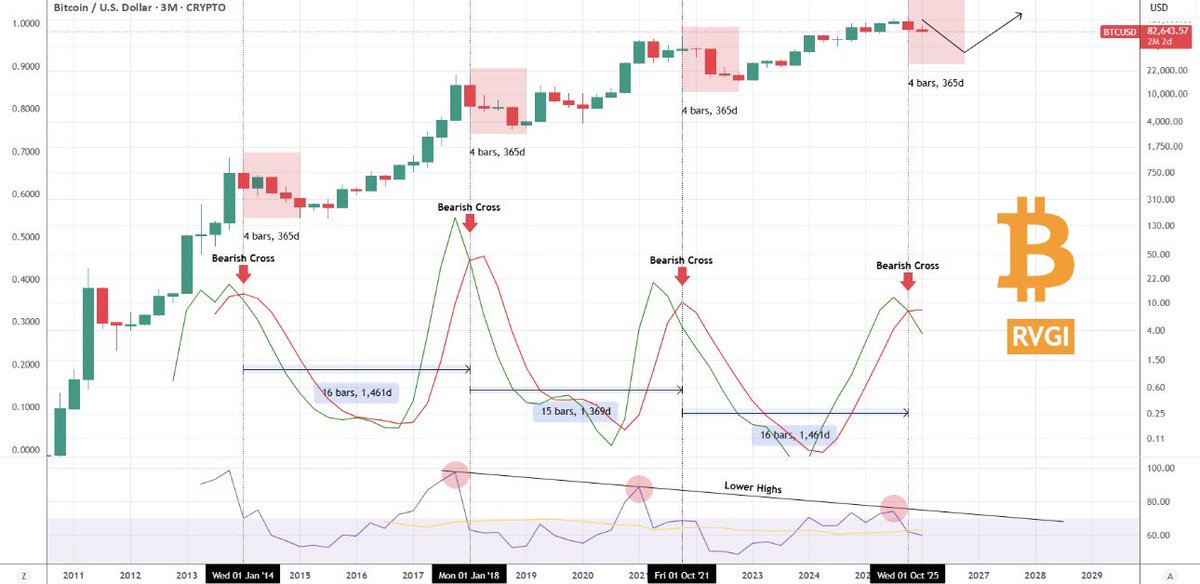
So what do yo think? Is the RVGI right to confirm the new Bear Cycle and pinpoint its bottom around October 2026? Feel free to let us know in the comments section below!
So what do yo think? Is the RVGI right to confirm the new Bear Cycle and pinpoint its bottom around October 2026? Feel free to let us know in the comments section below!
Bitcoin (BTCUSD) is currently past a Relative Vigor Index (RVGI) Bearish Cross on the 3M (quarterly) time-frame. This is a huge development as it is basically the last indicator to confirm the new Bear Cycle beyond any technical doubt.
In addition to the RVGI, take a look at the 3M RSI. The quarter before the RVGI Bearish Cross topped on the 7-year Lower Highs trend-line, consistent with all previous Highs.