@RobinhoodApp Any timeline on when invites go out for banking? I use the gold card and invest with RH. Just need to move banking over to have my one stop shop
After working in finance for over 6 years and hosting 5,000+ hours of Spaces...
I've found there are consistently 15 metrics I consider for each stock I invest in.
Here’s a breakdown of them in plain English:
𝟭) 𝗦𝘁𝗿𝗼𝗻𝗴 𝗠𝗮𝗻𝗮𝗴𝗲𝗺𝗲𝗻𝘁
Poor management can destroy great businesses.
And strong management can make an average company great.
Strong management looks like this:
• CEOs w/ decades of experience
• Compensation aligning with the industry
• Management personally invests in company stock
𝟮) 𝗚𝗿𝗼𝘄𝘁𝗵 𝗽𝗿𝗼𝘀𝗽𝗲𝗰𝘁𝘀
Figure out a company’s growth prospects by asking:
• New industry?
• Declining industry?
• How’s customer sentiment?
• How’s customer acquisition?
• What sales strategies are used?
• Will they stay in the same market?
Growth potential = Potential returns.
𝟯) 𝗖𝘂𝘀𝘁𝗼𝗺𝗲𝗿𝘀
Do they have a diversified customer base?
This:
• Hedges against competition
• Allows company to reinvest
• Helps meet debt obligations
A business with multiple customers is safer than one that’s exposed to an unreliable market.
𝟰) 𝗢𝘂𝘁𝘀𝗶𝗱𝗲 𝗶𝗺𝗽𝗮𝗰𝘁
What factors outside of the company’s control can impact it?
Think:
• Lawsuits
• Govt policy
• Competition
• The economy
Understand the impact they have to understand a company’s future.
𝟱) 𝗜𝗻𝗻𝗼𝘃𝗮𝘁𝗶𝗼𝗻
Businesses should improve with technology.
If it doesn’t, it loses market share to a competitor.
Companies that leverage new tech are more versatile and adaptive.
This makes them attractive investments.
𝟲) 𝗠𝗼𝗮𝘁
Aka competitive advantage.
Here are some to consider:
• Size
• Patents and IP
• Barriers to entry
• Production costs
• Customer loyalty
A sustainable advantage increases your chances of profiting.
𝟳) 𝗦𝘁𝗮𝗯𝗹𝗲 𝗺𝗮𝗿𝗸𝗲𝘁
Volatile markets make it difficult to exit a position.
It’s hard to time it right.
And when it’s hard to time an exit you risk compromising on your return.
That’s why I prefer stable industries over cyclical ones.
𝟴) 𝗖𝗮𝘀𝗵 𝗳𝗹𝗼𝘄
When evaluating cash flow, ask:
• Are they subject to economic cycles?
• Can the cash flow cover debts?
• Does the company have a subscription service and/or a low churn rate?
Questions like this will help you determine a company’s profitability.
𝟵) 𝗤𝘂𝗶𝗰𝗸 𝗿𝗮𝘁𝗶𝗼
This will tell you if a business has enough assets to pay upcoming debts.
Equation:
Current assets ÷ Current liabilities = Quick ratio
A quick ratio of 1 is normal.
But in general, you want a quick ratio above 1.
𝟭𝟬) 𝗡𝗲𝘁 𝗽𝗿𝗼𝗳𝗶𝘁 𝗺𝗮𝗿𝗴𝗶𝗻
This shows you how much money a company makes for every $1 in sales.
In other words... profit.
This helps you determine whether there are healthy profits and if operating costs are reasonable.
Equation:
Net income ÷ Revenue = Net profit margin
𝟭𝟭) 𝗥𝗲𝘁𝘂𝗿𝗻 𝗼𝗻 𝗔𝘀𝘀𝗲𝘁𝘀
ROA shows you how efficiently a company uses its resources to generate profits.
But it varies from industry to industry.
So the best way to find a good ROA is to compare it with companies in the same industry.
Equation:
Net income ÷ Total assets = ROA
𝟭𝟮) 𝗘𝗮𝗿𝗻𝗶𝗻𝗴𝘀 𝗽𝗲𝗿 𝘀𝗵𝗮𝗿𝗲
This shows how much money a company makes per share of stock.
The higher the EPS the more valuable the company.
Equation:
Profit ÷ Outstanding shares = Earnings per share
𝟭𝟯) 𝗣/𝗘 𝗥𝗮𝘁𝗶𝗼
It shows how much a company is worth & how much investors are willing to pay for each $1 of earnings.
High P/E ratio = stock is overbought or investors are bullish.
Low P/E ratio = stock is oversold or investors are bearish.
Equation:
Share price ÷ EPS = P/E ratio
𝟭𝟰) 𝗣𝗿𝗶𝗰𝗲 𝘁𝗼 𝘀𝗮𝗹𝗲𝘀 𝗿𝗮𝘁𝗶𝗼
Applies mostly to growth stocks with no profits.
The lower the price to sales ratio, the more attractive the investment is.
Equation:
Market cap ÷ Annual sales = price to sales ratio
𝟭𝟱) 𝗘𝗻𝘁𝗲𝗿𝗽𝗿𝗶𝘀𝗲 𝗠𝘂𝗹𝘁𝗶𝗽𝗹𝗲
Shows how a company would be viewed before a potential acquisition.
A good or bad multiple varies from industry to industry.
So compare it with other companies in the same industry.
Equation:
Enterprise value ÷ EBITDA = Enterprise Multiple
𝗧𝗵𝗲𝗿𝗲 𝘆𝗼𝘂 𝗵𝗮𝘃𝗲 𝗶𝘁!
The 15 metrics I consistently review before investing in a particular stock.
If you found value in this post, follow me @WOLF_Financial for more, and smash that repost button!
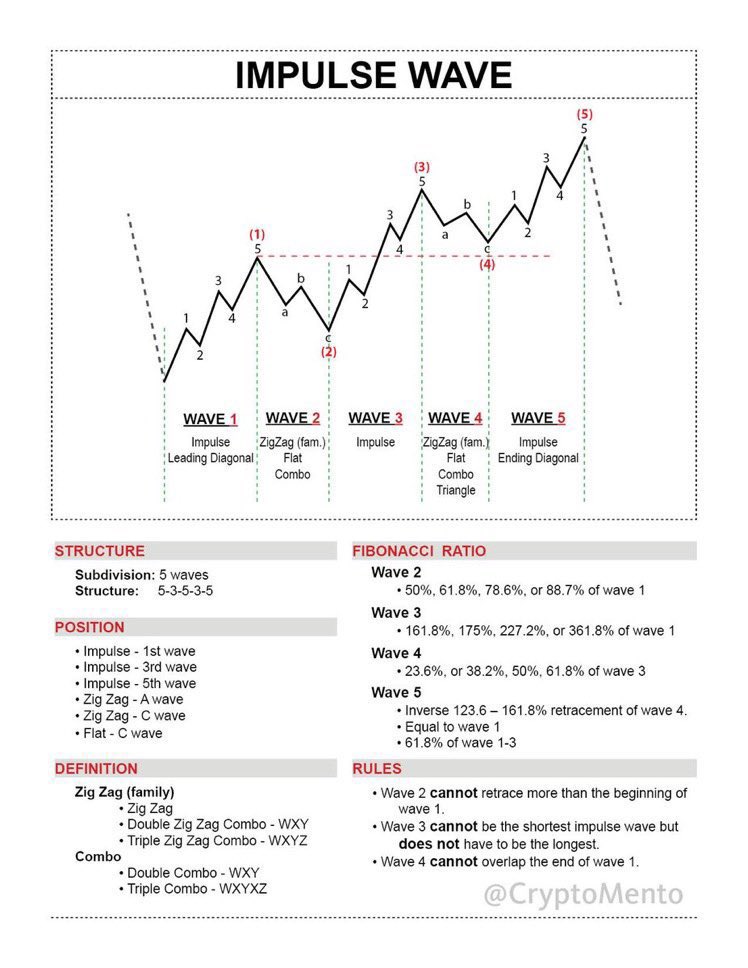
What Is Elliott Wave Theory?
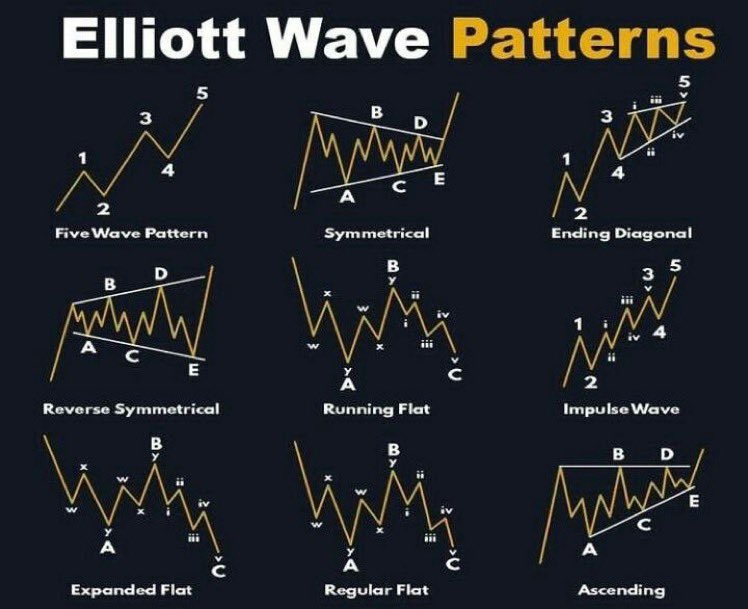
Elliott Wave Theory is a method of technical analysis that traders use to analyze and quantify price patterns in financial markets by looking at cycles. The theory believes that changes in investor sentiment and their psychology creates impulse waves and corrective waves inside the larger trends in market price action.
The theory attempts to forecast market trends by identifying the most extremes in trader’s collective psychology that create the highs and lows in price action.
Ralph Nelson Elliott developed the theory of the underlying principles and created the analytical tools back in the 1930s. He believed that prices in markets play out in specific wave patterns, which his followers call ‘Elliott waves’.
In 1938, he published this theory of market behavior in his book ‘The Wave Principle’. In 1946, he covered his Elliott Wave Principles most completely in his final book: ‘Nature’s Laws: The Secret of the Universe’.
Elliott wave analysts believe that each wave has its own characteristic, which usually is a reflection of the psychology of the current market move.
Understanding the characteristic is thought to be the key to the correct use of the Elliott Wave Principle.
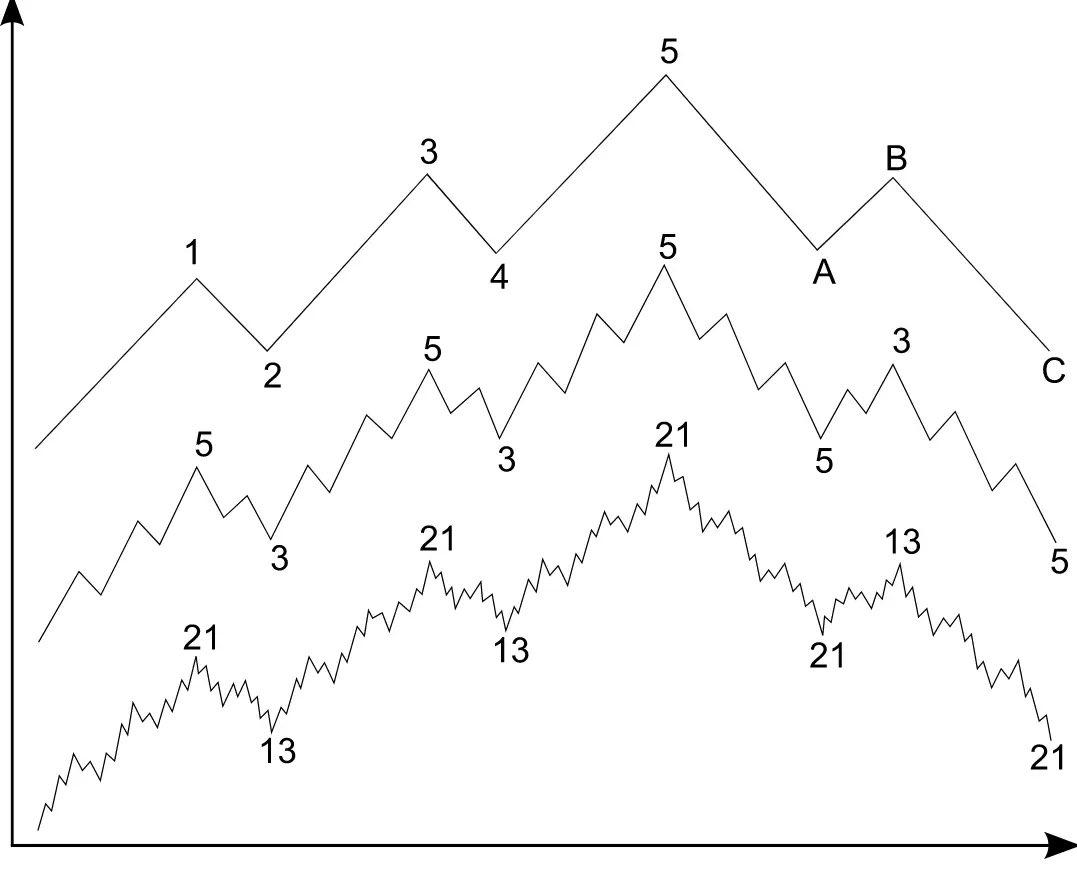
Elliott Wave definitions below assume a bullish stock market; the characteristics apply as the opposite in bear markets.
The five wave pattern inside the dominant market trend.
Wave 1: Wave one is rarely obvious at its inception. When the first wave of a new bull market begins, the fundamental news is almost universally negative. The previous trend is considered still strongly in force. Fundamental analysts continue to revise their earnings estimates lower; the economy probably does not look strong. Sentiment surveys are decidedly bearish, put options are in vogue, and implied volatility in the options market is high. Volume might increase a bit as prices rise, but not by enough to alert many technical analysts.
Wave 2: Wave two corrects wave one, but can never extend beyond the starting point of wave one. Typically, the news is still bad. As prices retest the prior low, bearish sentiment quickly builds, and “the crowd” haughtily reminds all that the bear market is still deeply ensconced. Still, some positive signs appear for those who are looking: volume should be lower during wave two than during wave one, prices usually do not retrace more than 61.8% of the wave 1 gains, and prices should fall in a three wave pattern.
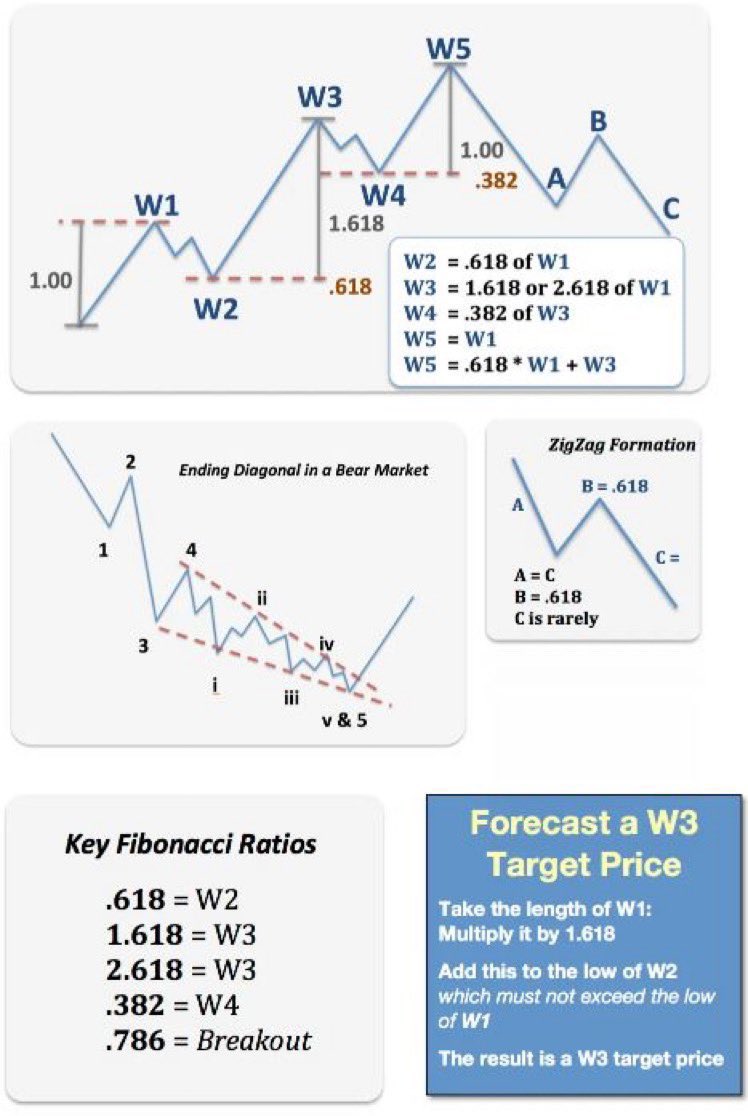
Wave 3: Wave three is usually the largest and most powerful wave in a trend, although some research suggests that in commodity markets, wave five is the largest. The news is now positive and fundamental analysts start to raise earnings estimates. Prices rise quickly, corrections are short-lived and shallow. Anyone looking to ‘get in on a pullback’ will likely miss the boat. As wave 3 starts, the news is probably still bearish, and most market players remain negative; but by wave 3’s midpoint, ‘the crowd’ will often join the new bullish trend. Wave 3 often extends wave 1 by a ratio of 1.618:1.
Wave 4: Wave four is typically clearly corrective. Prices may meander sideways for an extended period, and wave four typically retraces less than 38.2% of wave 3. Volume is well below than that of wave 3. This is a good place to buy a pull back if you understand the potential ahead for wave 5. Still, 4th waves are often frustrating because of their lack of progress in the larger trend.
Wave 5: Wave five is the final leg in the direction of the dominant trend. The news is almost universally positive and everyone is bullish. Unfortunately, this is when many average investors finally buy in, right before the top. Volume is often lower in wave 5 than in wave 3, and many momentum indicators start to show divergences, prices reach a new high but the indicators do not reach a new peak.
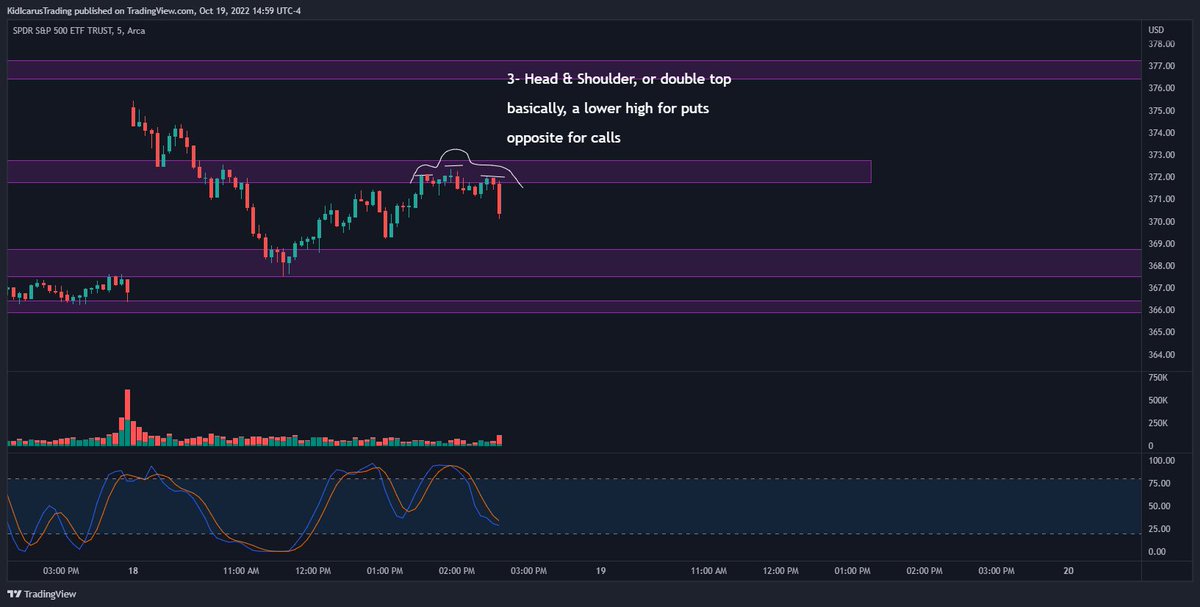
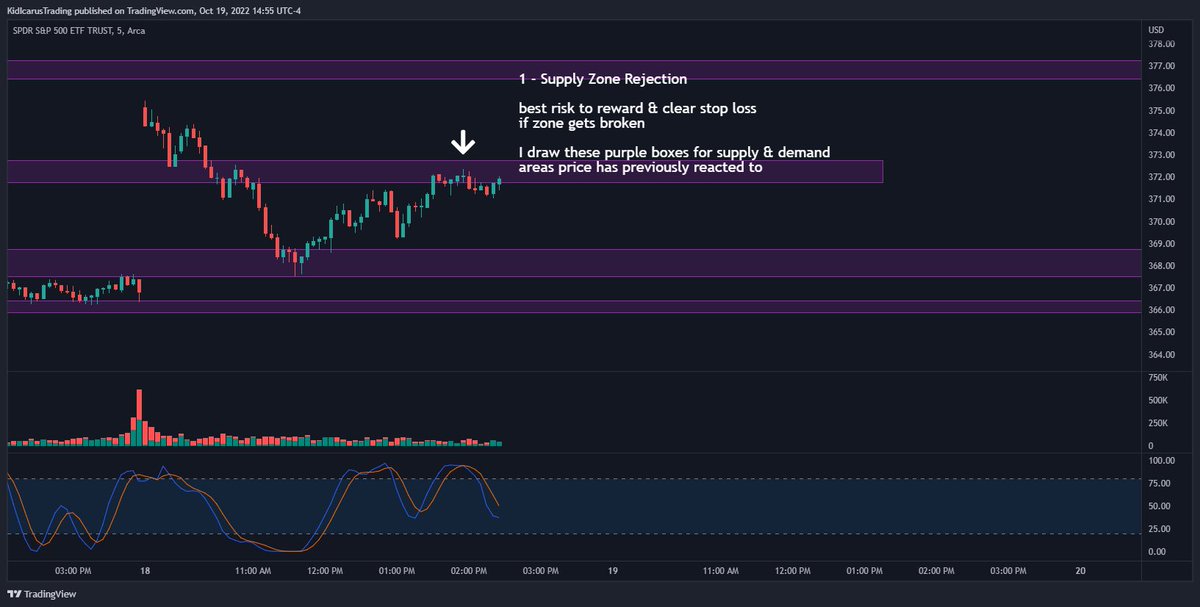
⭐️ MY A+ SETUP EXPLAINED ⭐️
How I made 250% GAIN on $SPY puts this week! (And every other week)
Use the #MapleStrat to consistently manage risk and to have a trade plan! My rule is to always scale on pivot breaks after taking entry on a pullback. This allows me to offload risk and stay in control of my emotions. Trade like a robot 🤖
I hope this helps, leave a like ❤️ for more charts!
#AUTOLEVELS
I stripped the original AutoLevels indicator to a bare minimum.
Looks just like the new MINIMAL CHART option without the open price line.
Great option for naked charting.
No extensions either. Below is what you get.
AutoLevels is an indicator I published to Tradingview. (Link below)
It provides accurate support/resistance Go Long/Short levels for any ticker.
This 🧵 will journal examples.
https://t.co/1pxz6ctjsa
Ok if I give you everything an hour early? 🎁
Levels for both TradingView and thinkorswim. As well as a new study for thinkorswim for scanning + 4 example scans:
https://t.co/QnkxZYrmgq
Pivot Ribbon
https://t.co/3TCrNJhTtt
A thread of what's new 👇
⚠️ THE TRUTH ABOUT BACKTESTING THAT NO ONE HAS TOLD YOU.⚠️
As a developing trader you must have heard many people say, you have to keep backtesting in other to gain confidence.
Well, that is true. But there's something no one has told you.
Walk with me.
Turning $5,000 -> $84,000 in 3 months with Futures
This is how I started off with a small account not trading #Options
Here is everything you need
🧵👇
Below is a thread containing some thoroughly annotated A and A+ setups I have taken over the last few months. Max sizing is 10% of port on A setups and 20% on A+. I have defined an "A" setup as containing 3-4 pieces of conviction, and A+ as containing 5+. All setups are on $SPY
@MiamiXMenNerd @DwyaneTrade3 @MasterBJones Excellent point on “how much was risked”? I have my options buys to default to a 10% SL and 15% TP. Managed the trade conservatively to, at worst, break even. Risk management is a key lesson that I’m still learning about every day!
@MiamiXMenNerd @DwyaneTrade3 @MasterBJones 2.64 for the $SPY con, set SL at BE once in profit, targeted 15% gain. Exited at 3.04. Wiped out a previous loss earlier in the day to end +$10 green. Not much in terms of $ value, but a much needed mental win!
I've tweeted for over 5 years...
and NEVER shared this strategy once
Take 30 seconds out of your day to learn the strategy that I use as a full-time trader:🧵
Here’s a short version of my tweet thread. A+ Setup and what each part looks like. 4 pieces of conviction.
Only stochastic oscillator, drawn zones and trend lines.