• $T | Notes
Serious price signatures of accumulation on all higher timeframes especially the monthly and quarterly.
Building a base above the prior trend resistance and all time POC - watching for price stability above equal highs for a potential long dated swing entry.
• $HUN | Notes
Starting to build volatility and session volume here while coiling and tightening around this current POC.
Very flag like structure here after establishing a higher low above this volume imbalance.
Higher timeframes starting to show signs of a reversal attempt.
• $HSY | Notes
Rebalancing this earnings gap where price managed to clear that POC and is now attempting to stabilize above.
Would like to see price lock a higher low above the POC and begin to build above that (231.00) volume node in order to see further expansion.
• $KR | Notes
Price is forming a tight pennant type formation here above these prior 2022 highs while displacing and confirming strength above the session POC.
Would watch for a continuation to expansion of price can verify strength out of this area of fair value.
• $CSX | Notes
Testing these prior 2022 highs where price has been pinned below in a consolidation range for 2 years now.
Watching for price to validate a higher low here above these prior highs to validate a potential range expansion.
Fib extensions would act as targets.
• $ABBV | Notes
Breaking down below these prior range lows and volume shelf 211.00 - 213.00
Attempting to establish a lower high here below these prior range lows after sellers fueled acceptance after failing to reclaim those short term highs.
Loss of 50W ma > continuation
• $GOOGL | Notes
Lost massive support at that 296.00 volume shelf acting as multi week prior range low.
Starting to see continued expansion lower below that area of value and current session POC - fair value could act as a short term pivot for another short to develop.
• $SEDG | Notes
Displaying relative strength despite broader market weakness - beginning to round out here above session POC while keeping current trend structure in tact.
Continued strength over prior highs could give buyers a chance to fuel expansion and a continuation.
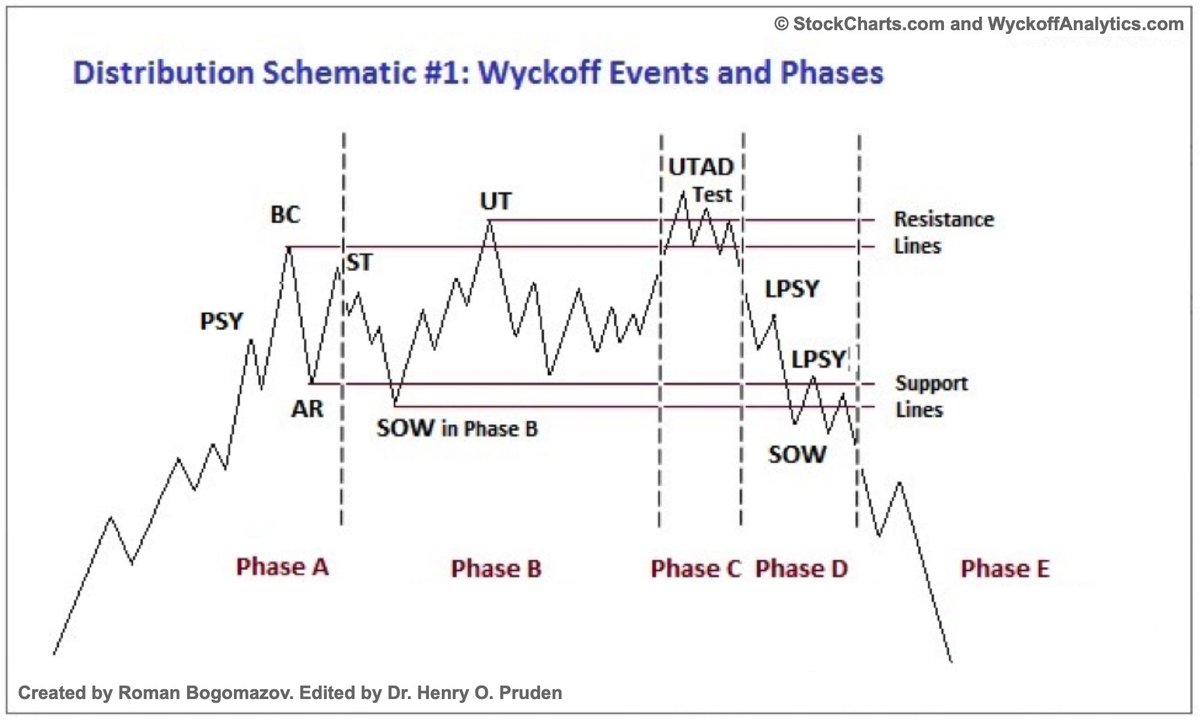
• $DXY $RSP | Notes
Divergence for the 🐻
$DXY ~ accumulation phase d
$RSP ~ distribution phase d
Risk off signals for equities
Strength in the dollar raising concerns and weakness for equities and indices.
Wycoff is still with us a century later.
• $AMD
More short exposure directly correlated to $SMH and semis.
Saw expansion lower below session POC validating a lower high - bigger picture painting this channel lower coming off all time highs.
Massive session gap below as well.
🎯 PT - Swing Low
🎯 PT - Gap Fill
• Open Positions | Short Exposure
Running through my current short swing positioning as the broader market continues to show signs of a developing risk-off environment - with technicals beginning to align with a near-term distribution phase and corrective price cycle.
Current Thesis 🧵
𝗠𝗮𝗿𝗸𝗲𝘁 𝘀𝘁𝗿𝘂𝗰𝘁𝘂𝗿𝗲
All major indices are beginning to expand following the loss of prior multi-week consolidation ranges, now trading below recent value while failing to reclaim all-time highs.
Clear signs of distribution are starting to emerge post-structure shift:
• Expansion below session POC
• Acceptance below prior range lows
• Lower Highs established
• Loss of prior value / rotation lower
𝗠𝗮𝗰𝗿𝗼
Zooming out we’re starting to see early signs of a transition toward a more risk off backdrop
• Slowing liquidity expansion
• Rate Path Uncertainty
• Shift to data dependency
Paired with persistent geopolitical headline risk, which typically suppresses sustained risk - on flows.
Short positions ⬇️
• $AAPL
May 15th 220P ~ 3.45
Cons currently up +11%
Most directional exposure for my current short thesis.
Failed to hold 2024 ATH while printing a lower high below that short term high - watching for further rotation back into session POC
🎯 PT - POC
🎯 PT - Fair Value
• $XLK | Trade Update
Cons sitting in profit following the close of yesterday’s session below those prior equal lows of the previous trading range.
Watching for acceptance below those prior lows to speed up and seek lower imbalance price targets.
Clean setup so far !
• $XLK | Trade Entry
$XLK 6/18 127.5P ~ 4.90
Confirming a lower high below session POC - while failing below prior trend structure support.
Watching for continued acceptance below prior month low for an expansion move to confirm lower - with targets at that swing low.
• $WMT | Notes
Flagging back into session POC here after drifting off the most recent all time high print in last months session.
Would watch for a failure below POC to validate a shift in structure and early signs of a potential reversal back into discount ranges.
• $BE | Notes
Failing below that prior multi week balanced range while sellers are fueling acceptance below prior consolidation.
Clear lower high created below the session POC with fair value sitting below those range lows.
On Watch for a rebalance into fair value.
• $BE | Notes
Been coiling and trading within this balanced area of value for multiple months now following the break of the prior all time highs.
Acceptance below session POC would confirm a retracement move back into that fair value range in my opinion.
• Risk Off | Macro Thesis
Markets are telling a much clearer story beneath the surface than the index would suggest.
On paper, $SPY is only -6% off highs - relatively controlled, almost resilient. But under the hood, the largest drivers of that index are in far deeper retracements:
$MSFT : -30%
$AMZN : -26%
$META : -24%
$AAPL : -8%
This is divergence — and not the healthy kind.
What we’re seeing is index stability being artificially supported while the underlying components are already pricing in something much worse. That’s not strength. That’s distribution.
Now layer in the macro:
Liquidity is tightening. Global central banks are no longer acting as shock absorbers - they’re the source of pressure. The era of excess liquidity masking structural weakness is fading, and markets are starting to reprice accordingly.
At the same time, energy is re-emerging as a risk vector. An oil shock doesn’t just hit gas prices - it feeds directly into inflation expectations, compresses margins, and forces policymakers into a corner. If inflation remains sticky because of energy, rate cuts get delayed. If rates stay higher for longer, equity multiples compress further.
That’s the feedback loop.
So you end up with:
- Weakening breadth
- Mega caps in deeper drawdowns
- Tightening liquidity
- Energy-driven inflation risk
- Rates staying restrictive
That combination doesn’t support a risk-on environment.
It supports a transition.
The index hasn’t fully caught up yet - but historically, when internals diverge this hard, price eventually reconciles with reality.